ShadowGlen vs. Neighbors: A Market Comparison
By George Arnold Alexander III, MPA · Associate Broker · 2026-10-24
Key figures · ShadowGlen · rolling 6 months ending Sep 30, 2026
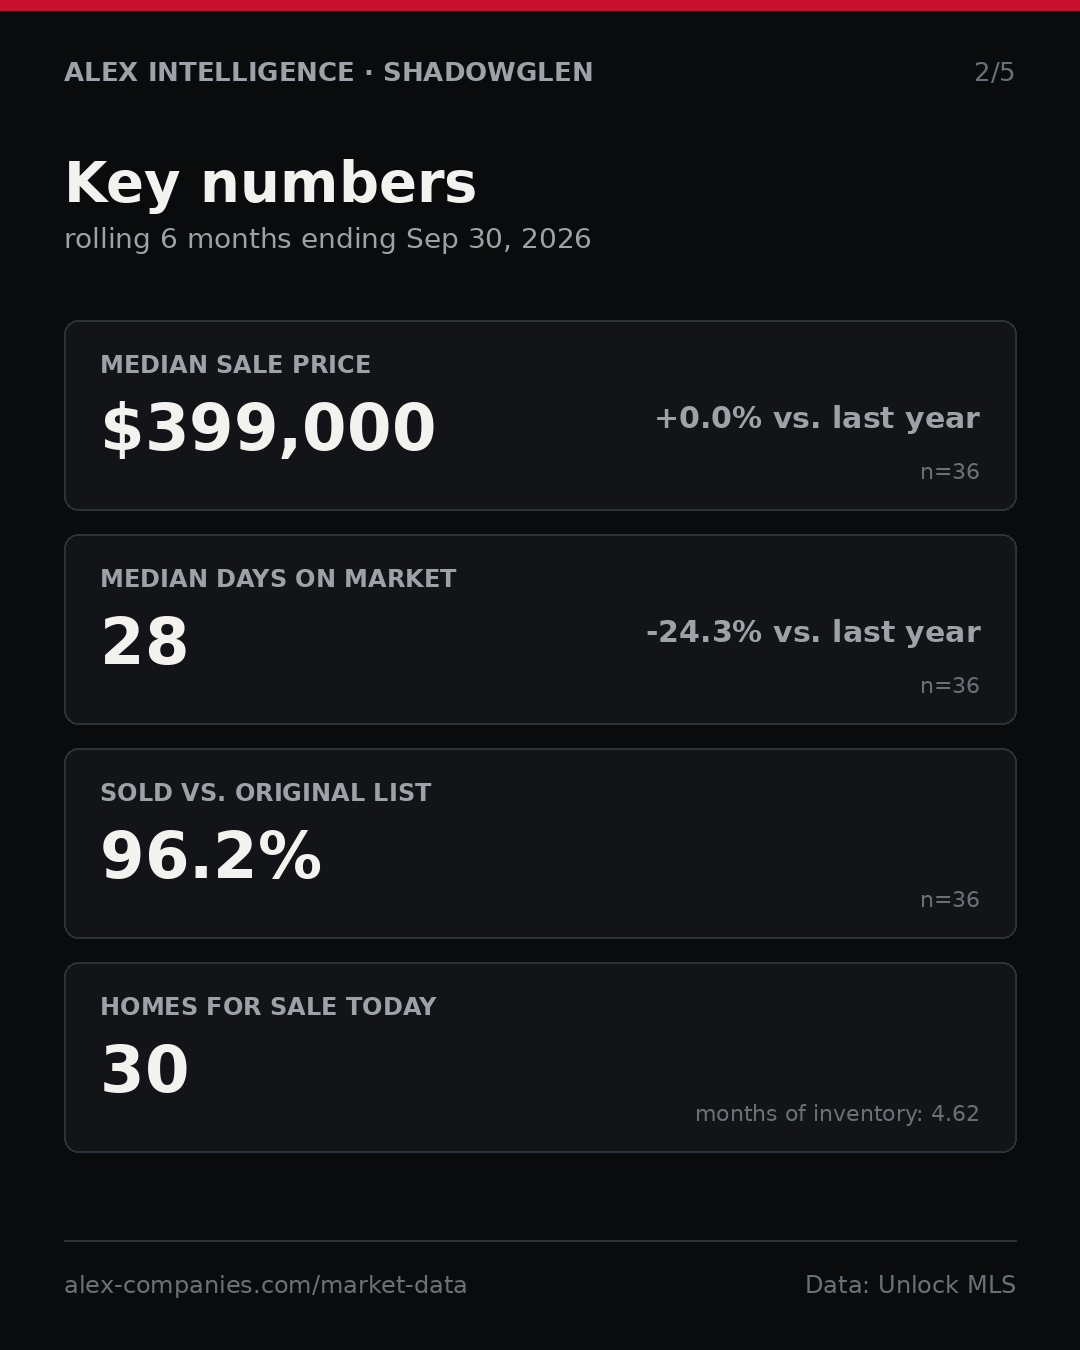
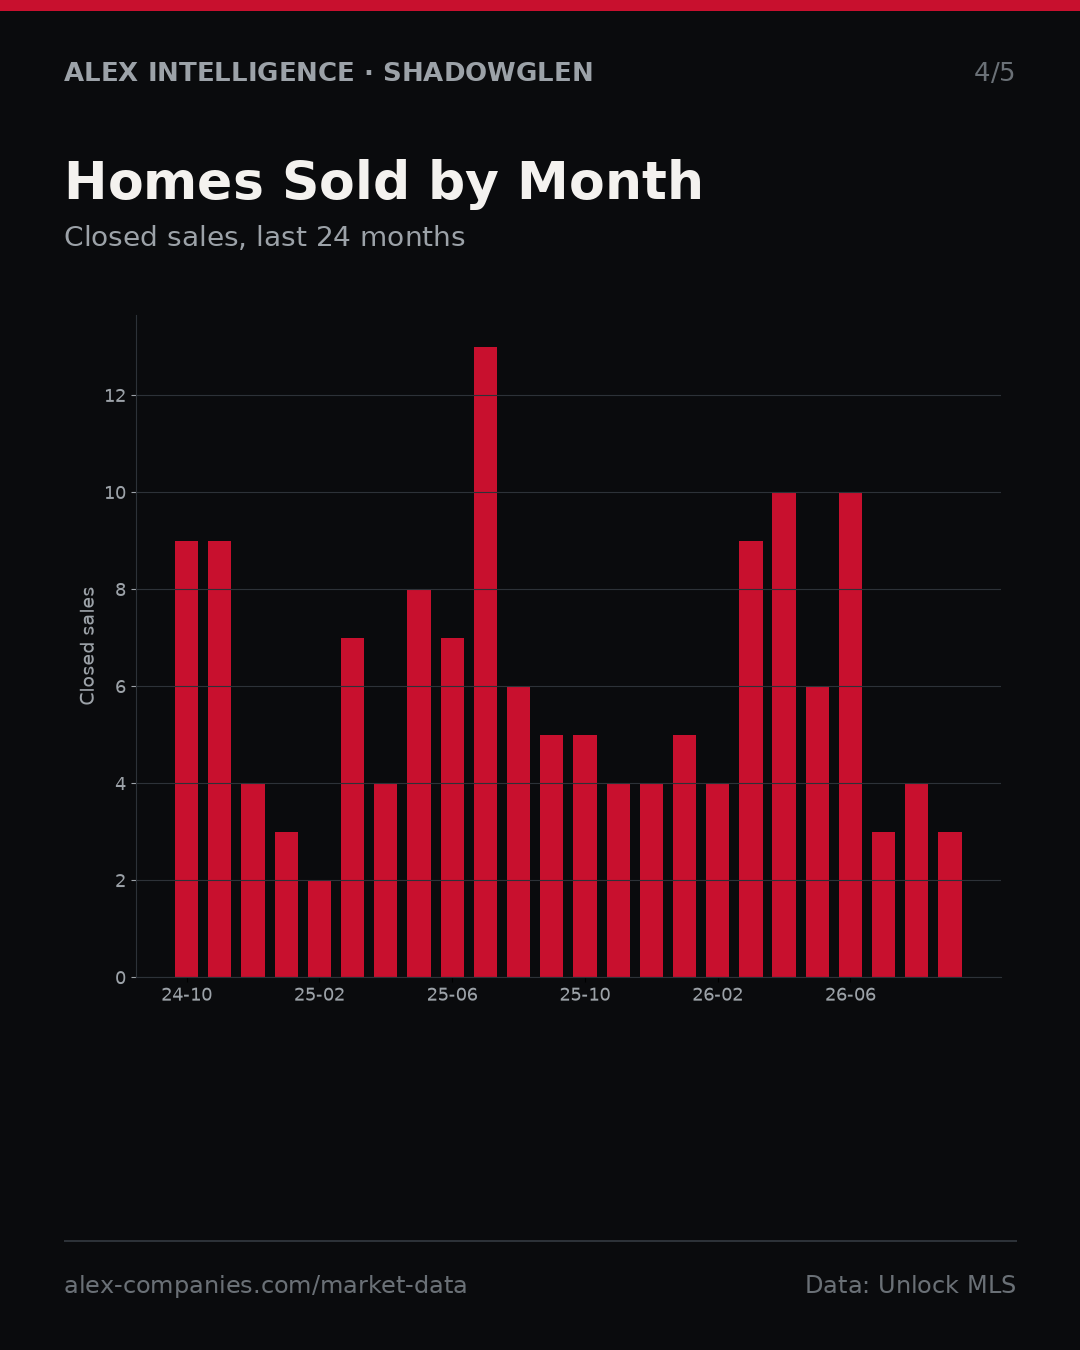
- 36 homes sold in ShadowGlen in the 6 months ending Sep 30, 2026 (down 16.3% on a year earlier).
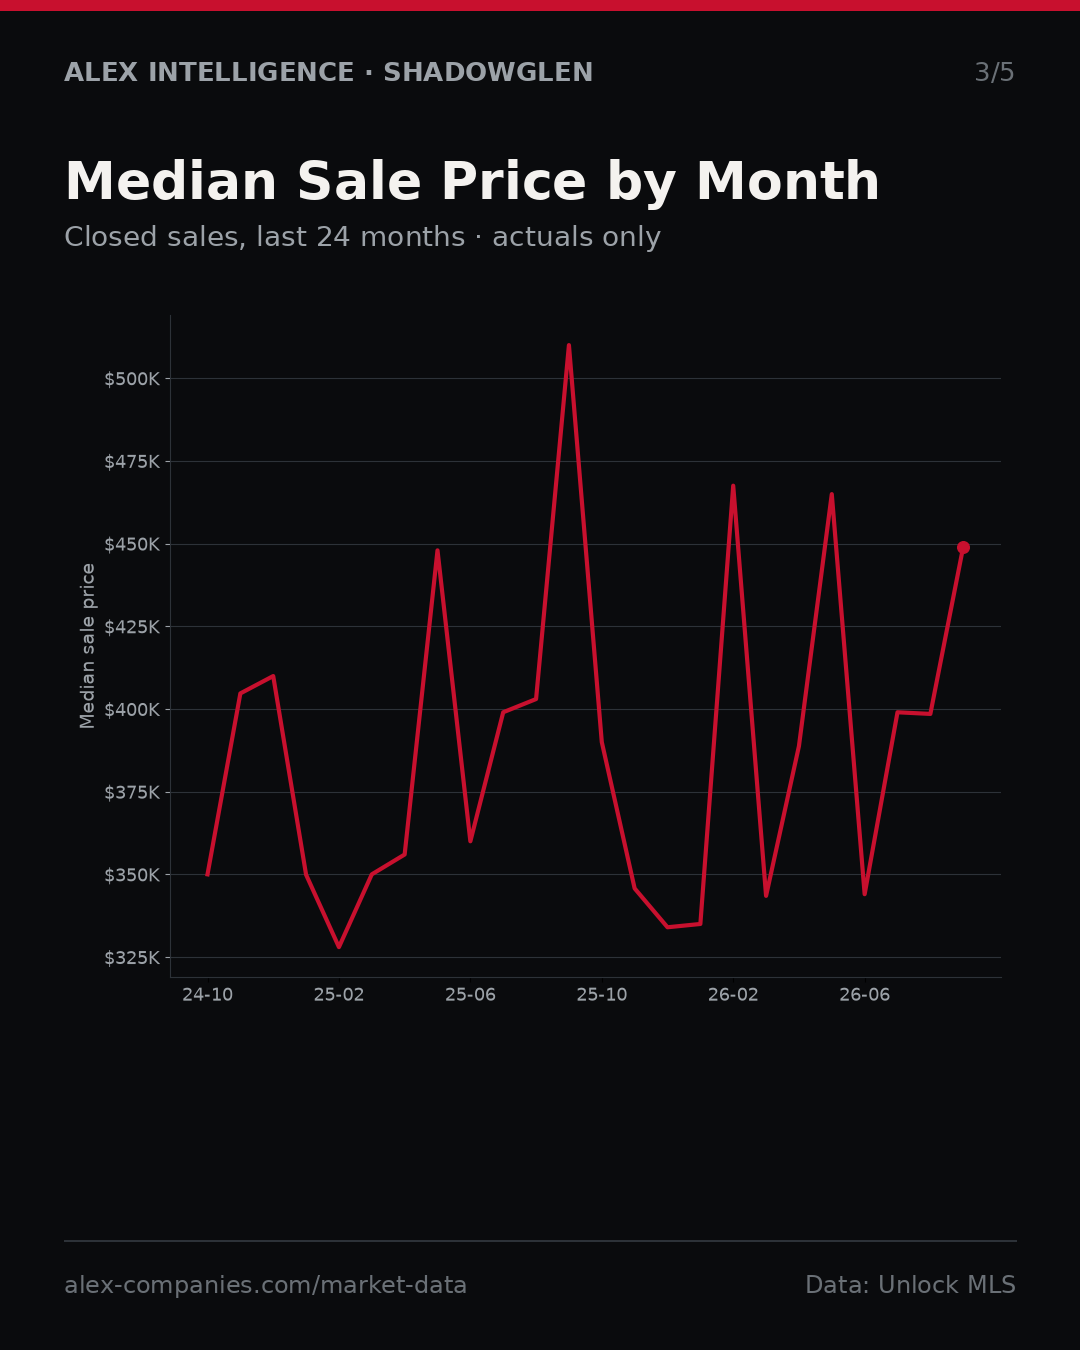
- Median sale price: $399,000 (unchanged on a year earlier).
- Median price per square foot: $166.
- Median days on market: 28.
- Median sale price as a share of the original list price: 96.2%.
- 30 homes for sale now, about 4.6 months of supply at the pace of the last six months.
Source: Unlock MLS, rolling 6 months ending Sep 30, 2026. Homes only (single-family, condo, townhome). Information deemed reliable but not guaranteed.
How does a master-planned community like ShadowGlen compare to its broader neighbors in the current market? The data shows distinct differences in price and speed of sale when viewed against regional benchmarks.
ShadowGlen closed 36 sales over the last six months with a median price of $399,000. This figure is identical to the same period last year but sits below the Travis County median of $491,000 for the same window. While ShadowGlen buyers are paying less per square foot at $166 compared to the county average of $251, the community is moving significantly faster than the broader region.
ALEX Intelligence analyzed the speed of transactions and found that homes in ShadowGlen spent a median of 28 days on market. This represents a 34.9% improvement over the prior six-month period and is well below the regional average of 56 days. The community also shows stronger price retention, with sellers achieving 96.2% of their original list price, outperforming the regional ratio of 94.1%.
Despite these efficiencies, ShadowGlen remains more affordable than its neighbors. The median price per square foot in the community is $166, whereas Travis County averages $251. This gap suggests that while buyers are finding value and speed within ShadowGlen, they are paying a premium for properties elsewhere in the county.
The market dynamics also highlight a shift in buyer behavior regarding financing and concessions. In ShadowGlen, 75% of sales closed below the original list price, a slight improvement from the prior period but still higher than the regional rate where 83.5% of deals fell short. This indicates that while the community is active, negotiation remains a key part of the transaction process for both buyers and sellers.
ShadowGlen's performance stands out as a distinct segment within the larger Austin area market, offering faster turnover and lower entry prices compared to the county-wide trends.
Want these numbers for your street? Email [email protected].
Data from Unlock MLS. Information deemed reliable but not guaranteed. Model outputs are ALEX Intelligence estimates, not appraisals.
Read more Central Texas market data on the ALEX blog: https://alex-companies.com/blog
MIT, Nvidia, Google & IBM-Trained. Cross Domain-Expert: Quantum, AI, Ethics, Sovereignty, Intelligence, Philanthropy. Solepoint Planning. VUI AI Cloud Architect. AI Certifications Development. Quant/AI Instructor. Castor Venture Club Member. Associate Broker.
George Arnold Alexander III, MPA
Director, ALEX Companies
Associate Broker, Alexander Tiffany Southwest, LLC dba ALEX.realestate, et.al.
Texas License #574878-B · Broker License #565194-BB
Broker, ALEX Real Estate · North Carolina License #367733
Independent Broker, ALEX Real Estate · Colorado License #II.100112456
[email protected] · +1 713.918.9951
Source data: Unlock MLS closed sales, rolling 6 months ending Sep 30, 2026, n=36
Licensed by the Texas Real Estate Commission. Broker: Alexander Tiffany Southwest, LLC · License #565194-BB.
Diane Hart Alexander, Chair & CEO, ALEX Companies · Designated Broker · #574877-B · George Arnold Alexander III, Director, ALEX Companies · Associate Broker · #574878-B
Texas Real Estate Commission Information About Brokerage Services · TREC Consumer Protection Notice · trec.texas.gov
Diane Hart Alexander, Chair & CEO, ALEX Companies · Designated Broker · #574877-B · George Arnold Alexander III, Director, ALEX Companies · Associate Broker · #574878-B
Texas Real Estate Commission Information About Brokerage Services · TREC Consumer Protection Notice · trec.texas.gov