Comparable-sales valuation · 16 September 2026
Serenada West Sec 4 · Georgetown, Texas 78628 · Williamson County · MLS 3434023
Prepared for Gary C. Blackburn · Prepared by Diane Hart Alexander, MBA, MHA, Designated Broker
Asking price
Listed 7 August 2026 at $559,000 and reduced to $540,000. Thirteen days on market.
The bars run from zero, so the cut reads at its true size: 3.4% is a modest reduction, and a chart with a cropped baseline would make it look like a collapse. The hatched cap on the original bar is the $19,000 that came off.
What this says
Three closed sales inside Serenada West, each adjusted to this property across 66 factors and to today's market, place it at $523,702. That is a net figure — what a seller keeps after covering buyer closing costs and repair credits — which is the basis every number on this page uses.
The $540,000 list is 3.1% above that, and inside the supported range. This is not a report saying the house is mispriced; it is a report saying where the evidence sits and how firmly.
Where everything is
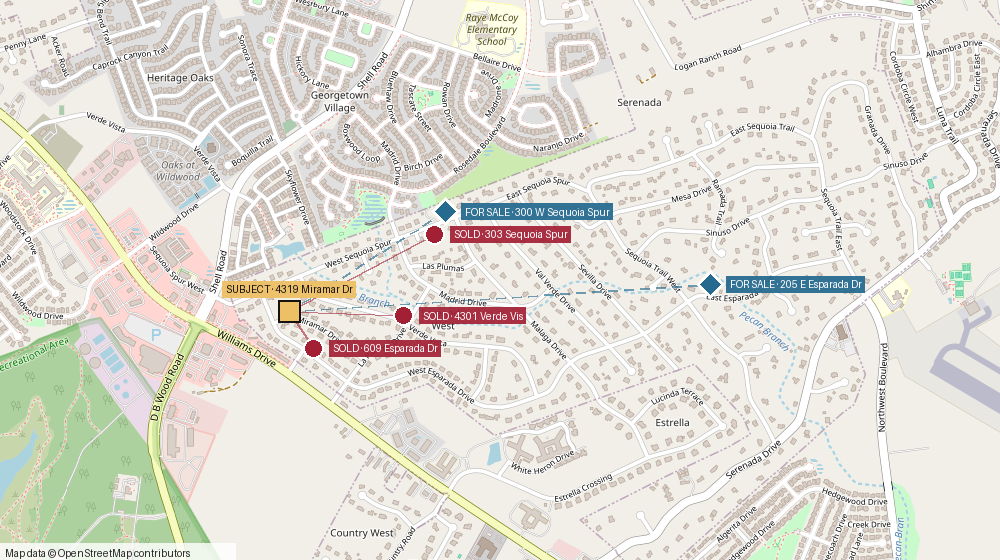
All three comparables lie within half a mile, inside the same subdivision. Click any red marker to jump to that sale in the table below.
4319 Miramar Dr
4301 Verde Vis
609 Esparada Dr
303 Sequoia Spur
300 W Sequoia Spur
205 E Esparada Dr
Distances from the subject: 609 Esparada 0.11 mi, 4301 Verde Vis 0.29 mi, 303 Sequoia Spur 0.42 mi. The two active listings are both around 22% larger than this house, past the size tolerance, so neither is a comparable — but they are what a buyer looking at this property will also be seeing.
How firm is it
Every figure below is computed from this property's own comparable set. Plain meaning first; the technical definition sits beneath each one.
The evidence
| Address | Closed | Close price | Net | Living area | Beds | Built | Adjustment | Adjusted |
|---|---|---|---|---|---|---|---|---|
| 4301 Verde Vis | 27 May 2026 | $545,000 | $544,200 | 2,052 sf | 3 | 1982 | +$9,614 | $553,814 |
| 609 Esparada Dr | 29 Jan 2026 | $482,500 | $482,500 | 2,086 sf | 3 | 1984 | +$14,557 | $497,057 |
| 303 Sequoia Spur | 16 Jun 2026 | $550,000 | $549,700 | 2,398 sf | 3 | 1979 | −$25,998 | $523,702 |
| Median of the three adjusted values — range $497,057 to $553,814, spread 10.8% | $523,702 | |||||||
Adjustments apply to net sale price — close price less seller-paid buyer closing costs and seller repairs — which is why the arithmetic runs off the Net column. Adjusted value = net + adjustment, and the indicated value is their median.
A sale more than ±20% from the asking price is not a comparable. The rule is absolute and applies before any other test. On a $540,000 list that band is $432,000 to $648,000, measured on net.
| MLS | Close | Net | From list | Why it would have hurt |
|---|---|---|---|---|
| 5450671 | $720,000 | $720,000 | +33% | Needed a −$281,477 adjustment, 39% of its own sale price, to be usable at all |
| 1459502 | $442,500 | $419,500 | −22% | $23,000 of seller-paid closing costs put the net below the band |
Removing them tightened the result rather than weakening it: the spread across the comparables fell from 24.5% to 10.8%, back-test error from 7.3% to 6.2%, and the search settled on closer matches. No comparable was drawn from an age-restricted community, none carries an HOA this property does not have, and none is this property's own prior sale.
Every adjustment
Nothing here is rolled up. Every adjustment the engine applied is listed with its amount and the reason it was made, and each table carries two blank lines for an agent to record a judgement the engine cannot make.
| Adjustment | Amount | Why it was made |
|---|---|---|
| Year Built | +$59,862 | The subject was built in 1993; this comparable is older, so its price is raised toward the subject. |
| Flooring | −$19,047 | Finish difference in flooring between the two houses. |
| Kitchen | −$15,000 | Kitchen finish level. |
| Mature Trees | −$5,442 | Mature tree cover the subject does not match. |
| Fireplace | −$5,000 | Fireplace the subject does not have. |
| View | −$4,354 | View difference. |
| Living Area | −$2,062 | Size difference, priced at the marginal rate rather than the average rate per square foot. |
| Market Timing | +$656 | The market moved between this sale and today, from the Williamson County repeat-sales index. |
| Net sale price | $544,200 | What the seller actually kept. |
| Total adjustment | +$9,614 | The rows above, summed. |
| Adjusted value | $553,814 | Net plus the total adjustment. |
| Agent adjustment | ||
| Agent comment |
Market timing basis: Williamson County repeat-sales index, 19,824 pairs — 2026-05 → 2026-09, 4 months, factor 1.0012 (+0.1%)
| Adjustment | Amount | Why it was made |
|---|---|---|
| Year Built | +$43,425 | The subject was built in 1993; this comparable is older, so its price is raised toward the subject. |
| Flooring | −$20,430 | Finish difference in flooring between the two houses. |
| Living Area | −$8,593 | Size difference, priced at the marginal rate rather than the average rate per square foot. |
| Study Office | +$4,825 | Dedicated study or office. |
| Mature Trees | −$4,825 | Mature tree cover the subject does not match. |
| Screened Porch | −$4,825 | Screened porch. |
| Soaking Tub | +$4,825 | Soaking tub. |
| View | −$2,412 | View difference. |
| Chandelier | +$2,000 | Light fixture of note. |
| Market Timing | +$568 | The market moved between this sale and today, from the Williamson County repeat-sales index. |
| Net sale price | $482,500 | What the seller actually kept. |
| Total adjustment | +$14,557 | The rows above, summed. |
| Adjusted value | $497,057 | Net plus the total adjustment. |
| Agent adjustment | ||
| Agent comment |
Market timing basis: Williamson County repeat-sales index, 19,824 pairs — 2026-01 → 2026-09, 8 months, factor 1.0012 (+0.1%)
| Adjustment | Amount | Why it was made |
|---|---|---|
| Year Built | +$76,958 | The subject was built in 1993; this comparable is older, so its price is raised toward the subject. |
| Living Area | −$70,310 | Size difference, priced at the marginal rate rather than the average rate per square foot. |
| Flooring | −$19,240 | Finish difference in flooring between the two houses. |
| Market Timing | −$15,406 | The market moved between this sale and today, from the Williamson County repeat-sales index. |
| Study Office | +$5,497 | Dedicated study or office. |
| Mature Trees | −$5,497 | Mature tree cover the subject does not match. |
| Soaking Tub | +$5,000 | Soaking tub. |
| Workshop | −$5,000 | Workshop structure. |
| Chandelier | +$2,000 | Light fixture of note. |
| Net sale price | $549,700 | What the seller actually kept. |
| Total adjustment | −$25,998 | The rows above, summed. |
| Adjusted value | $523,702 | Net plus the total adjustment. |
| Agent adjustment | ||
| Agent comment |
Market timing basis: Williamson County repeat-sales index, 19,824 pairs — 2026-06 → 2026-09, 3 months, factor 0.9720 (−2.8%)
The property
Land is priced at this parcel's own Williamson CAD rate — $124,254 across 23,087 square feet, or $5.38 per square foot — not a county average and not a third-party record. The county roll reconciles for every year on file: land plus improvement equals total.
Limits
This is a comparable-sales opinion of value, not a certified appraisal, and it is not a mortgage or lending document. It is produced from the ABOR feed, Williamson CAD records and ALEX's own adjustment engine, run automatically with no comparable selected by hand. Three comparables is the minimum from which a range can honestly be quoted — the set here is tight and consistent, but it is three sales, and a market this thin deserves that said plainly rather than buried.