ALEX · Executive Summary · Draft
103 Maria Court, Georgetown
Comparable-sales valuation · Listed Property Buyer Model · Williamson County
01What the evidence says this house is worth
ALEX’s statistical model, over five comparable sales. Each sale is carried to this property’s 2,104 square feet on the fitted size relationship, then weighted by how near it is to this house in the matching metric.
ALEX AI Statistical Model
Minimum
Average
Median
Maximum
Traditional Arithmetic Model
Minimum
Average
Median
Maximum
The same five sales counted equally, without carrying them to this house’s size. Why the two rows differ is below.
02Why the two rows differ
Every one of the five comparables is smaller than this house. They run 1,652 to 1,960 square feet against this property’s 2,104. A smaller house sells for fewer dollars but more dollars per foot, so averaging their per-foot rates and applying that rate here lifts the answer by about $30,000. The statistical model fits the size relationship from the sales themselves and carries each one to 2,104 feet before it counts — which is the whole of the difference between the two rows. The arithmetic figures are shown so that difference can be seen rather than taken on trust.
03The five sales behind the number
All five are in Sierra Vista, the subject’s own subdivision. Each column is one house, this one first. Every adjustment is shown at its final figure. A row marked Diane revised is one where she changed the AI’s figure for at least one sale, and her figures are in bold; the lines she added are listed separately. Size is not a dollar line: each sale’s adjusted price is divided by its own living area and applied to 2,104 square feet. The row with Diane’s adjustments is the Traditional Arithmetic row above, and the carried row, weighted, is the ALEX AI Statistical row; the AI only row shows where the sales stood before her changes.
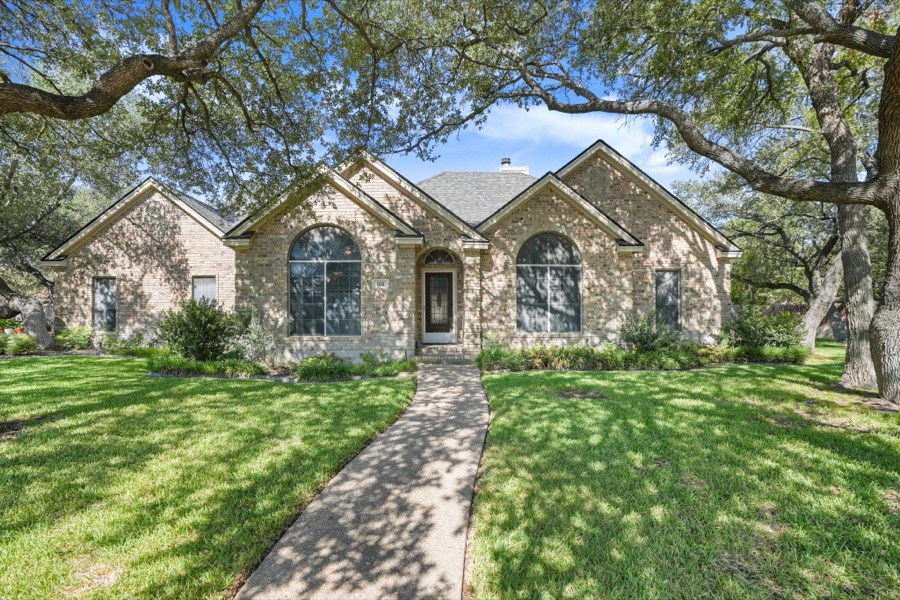 103 Maria CtThis houseMLS # 5525712 103 Maria CtThis houseMLS # 5525712 | 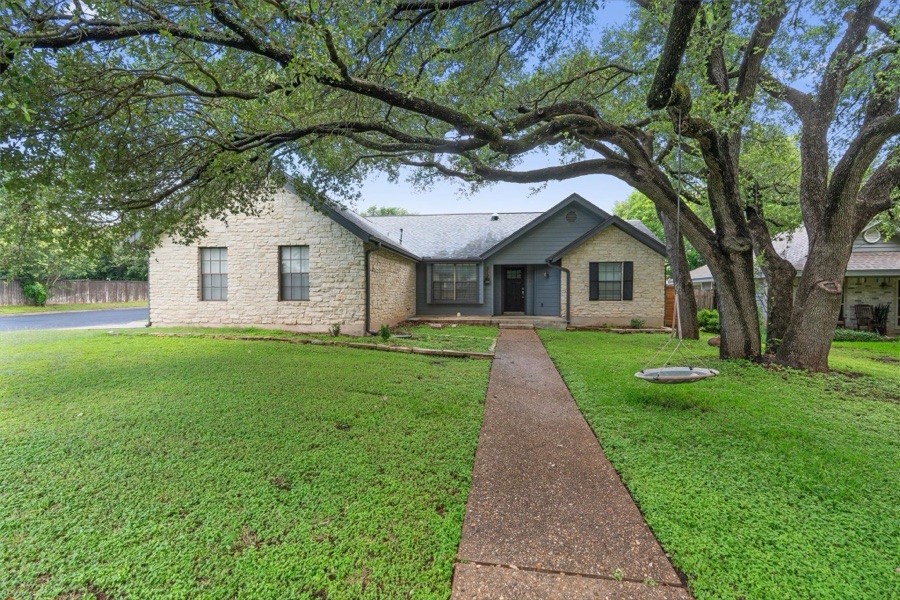 312 Susana DrSale 1MLS # 4046589 312 Susana DrSale 1MLS # 4046589 | 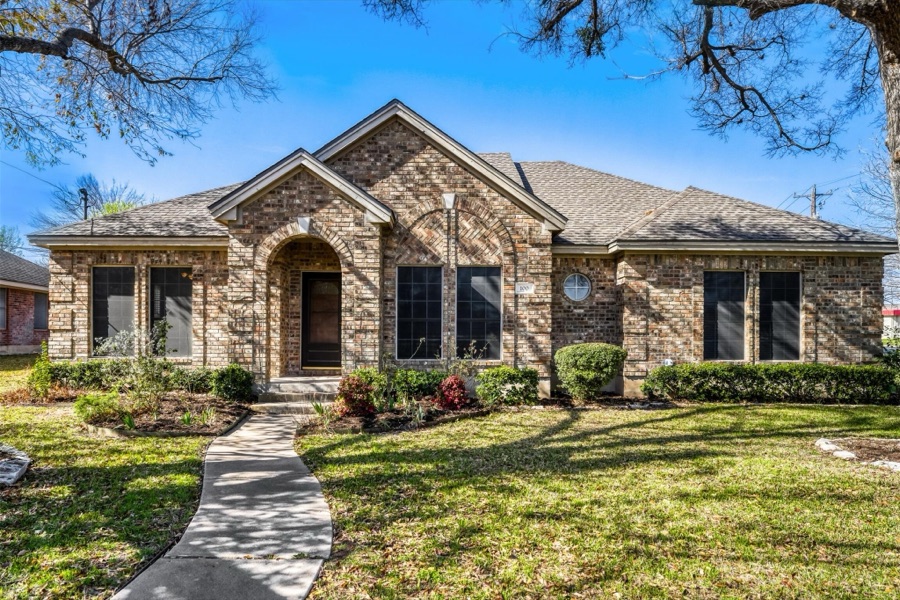 100 Susana DrSale 2MLS # 9111148 100 Susana DrSale 2MLS # 9111148 | 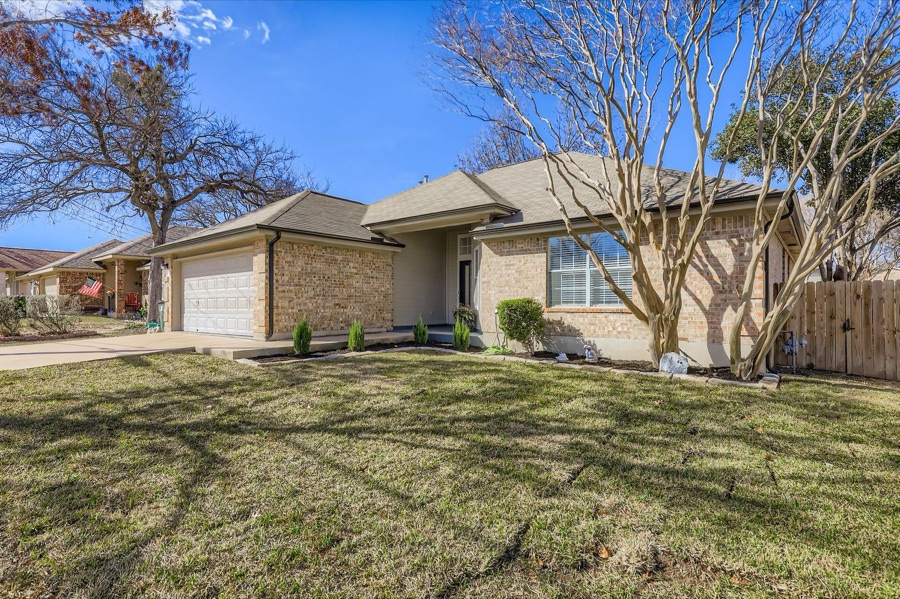 108 Susana DrSale 3MLS # 5219415 108 Susana DrSale 3MLS # 5219415 | 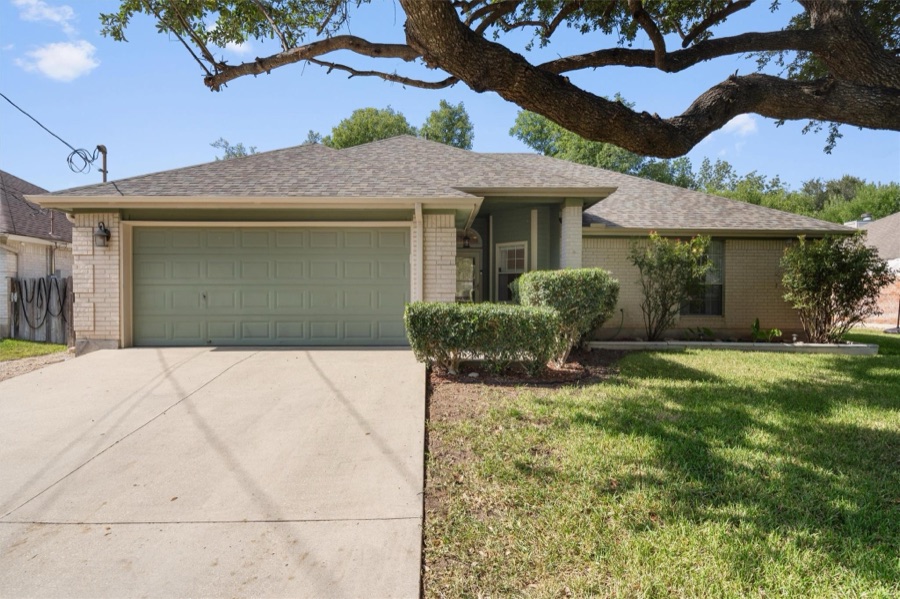 104 Susana DrSale 4MLS # 1592521 104 Susana DrSale 4MLS # 1592521 | 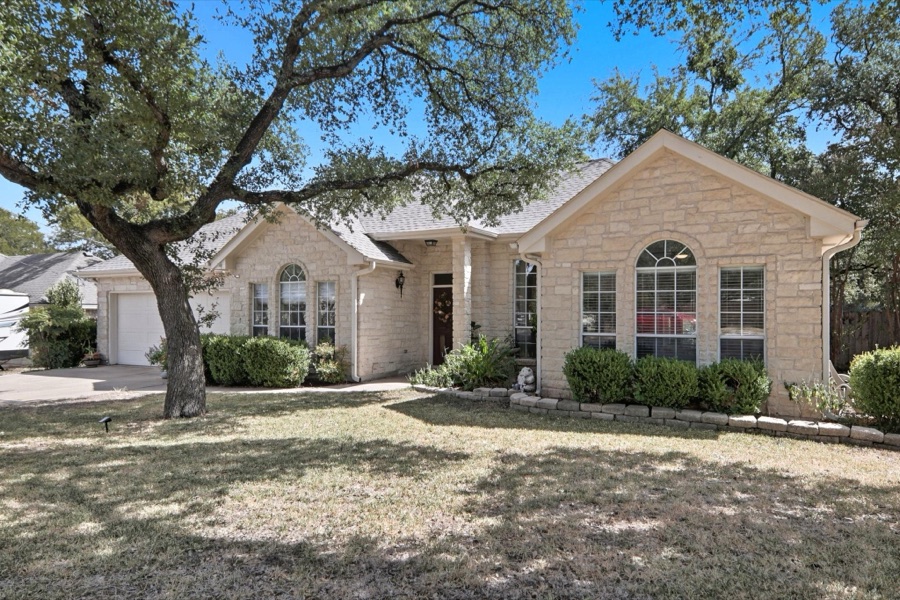 511 Debora DrSale 5MLS # 7511020 511 Debora DrSale 5MLS # 7511020 | |
|---|---|---|---|---|---|---|
| The house | ||||||
| Distance from this house | — | 0.31 mi NE | 0.60 mi NE | 0.55 mi NE | 0.58 mi NE | 0.05 mi SE |
| Living area | 2,104 sf | 1,960 sf | 1,652 sf | 1,690 sf | 1,770 sf | 1,931 sf |
| Bedrooms | 4 | 4 | 3 | 3 | 3 | 3 |
| Bathrooms | 2 | 2 | 2 | 2 | 2 | 2 |
| Year built | 1992 | 1985 | 1994 | 1995 | 1995 | 1993 |
| Lot | 17,437 sf | 8,830 sf | 15,520 sf | 8,181 sf | 8,329 sf | 12,066 sf |
| Garage | 2-car | 2-car | 2-car | 2-car | 2-car | 2-car |
| Levels | One | One | One | One | One | One |
| The sale | ||||||
| Listing date | Sep 24, 2026 | Jun 5, 2026 | Mar 2, 2026 | Jan 15, 2026 | Oct 16, 2025 | Oct 8, 2025 |
| Closed | Active | Jul 31, 2026 | May 22, 2026 | May 22, 2026 | Dec 3, 2025 | Nov 14, 2025 |
| Days on market | 5 | 28 | 41 | 102 | 10 | 6 |
| Original list price | $419,900 | $392,000 | $380,000 | $380,000 | $374,900 | $370,000 |
| Last list price | $419,900 | $378,280 | $374,900 | $359,900 | $374,900 | $370,000 |
| Closed price | — | $375,000 | $375,500 | $352,500 | $380,000 | $375,000 |
| Buyer closing costs paid by the seller | — | −$6,625 | −$6,000 | — | — | — |
| Repairs at the buyer’s request | — | — | −$6,729 | — | — | −$13,000 |
| Net sale price | — | $368,375 | $362,771 | $352,500 | $380,000 | $362,000 |
| Time adjustment — Williamson County repeat-sales index | ||||||
| Months from sale to today | — | 2 months | 4 months | 4 months | 9 months | 10 months |
| Index factor | — | 0.9852 (-1.5%) | 1.0065 (+0.6%) | 1.0065 (+0.6%) | 1.0151 (+1.5%) | 0.9882 (-1.2%) |
| Market trend to today | — | −$5,439 | +$2,350 | +$2,284 | +$5,724 | −$4,283 |
| Time-adjusted net sale price | — | $362,936 | $365,121 | $354,784 | $385,724 | $357,717 |
| Per square foot | — | $185 | $221 | $210 | $218 | $185 |
| AI & Diane Adjustments | ||||||
| Year built | — | +$25,786 | −$7,255 | −$10,575 | −$11,400 | −$3,620 |
| Lot size | — | +$40,724 | +$9,068 | +$43,795 | +$43,095 | +$25,412 |
| KitchenDiane revised | — | +$7,000 | — | −$15,000 | — | — |
| FlooringDiane revised | — | — | −$5,442 | −$5,288 | — | −$5,430 |
| Adjustments added by Diane | ||||||
| Master Bath | — | −$7,000 | — | −$15,000 | — | −$5,000 |
| Kitchen | — | — | −$4,000 | — | — | — |
| Back Yard | — | — | +$3,000 | — | — | — |
| 2nd bath | — | — | — | −$10,000 | — | — |
| Garage | — | — | — | −$2,000 | — | — |
| Yard/Trees | — | — | — | +$10,000 | — | — |
| Lighting | — | — | — | +$2,000 | — | — |
| Both Baths | — | — | — | — | −$10,000 | — |
| Yard Grooming | — | — | — | — | — | +$5,000 |
| From net sale price to this house | ||||||
| AI adjustments, including time | — | +$38,969 | −$4,906 | +$15,217 | +$20,319 | +$4,838 |
| Diane’s changes to AI lines | — | +$29,103 | +$3,628 | — | +$17,100 | +$7,240 |
| Diane’s added lines | — | −$7,000 | −$1,000 | −$15,000 | −$10,000 | — |
| Total adjustments | — | +$61,072 | −$2,278 | +$217 | +$27,419 | +$12,078 |
| Adjusted net sale price | — | $429,447 | $360,493 | $352,717 | $407,419 | $374,078 |
| Adjusted value per square foot | — | $219 | $218 | $209 | $230 | $194 |
| Indicated value at 2,104 sf — AI only | — | $437,272 | $455,779 | $457,796 | $475,859 | $399,704 |
| Indicated value at 2,104 sf — with Diane’s adjustments | — | $460,998 | $459,126 | $439,122 | $484,299 | $407,592 |
| Carried to 2,104 sf on the size slope — statistical model | — | $447,240 | $412,191 | $396,600 | $450,753 | $390,941 |
| Weight in the statistical model | — | 26.8% | 24.2% | 23.6% | 12.8% | 12.5% |
04The offer on the table, and the market around it
An offer of $419,900 has been made — the full asking price — with $8,000 of the buyer’s closing costs paid by the seller. Every figure in this report is a net sale price, what the seller keeps once any such contribution is taken out, so the offer belongs on that same basis: $411,900. That is the number to read against the two rows above.
Offer, contract price
Seller-paid costs
Offer, net to seller
County roll, 2026
Financing
Down payment
Days on market
Price reductions
05If the seller counters on the $8,000
Move the price, not the credit. For a buyer financing 100% with no down payment, that $8,000 is not a discount — it is the mechanism that makes the purchase closable, and part of it covers costs a VA buyer is not permitted to pay. Trading it away creates a cash requirement at the closing table that, by the structure of this loan, there is no cash set aside to meet. Raising the contract price while keeping the credit intact gives the seller the same thing they are asking for — a larger net — without moving that problem onto the buyer.
Every rung below keeps the full $8,000 and holds the net at or under the model’s own average, so nothing here asks the buyer to pay more than the sales support.
| Rung | Contract price | Seller credit | Net to seller | What it concedes |
|---|---|---|---|---|
| Where it stands | $419,900 | $8,000 | $411,900 | Full asking price; the credit is the only ask. |
| Split the difference | $424,000 | $8,000 | $416,000 | Half the room between here and the model average. |
| Ceiling | $428,100 | $8,000 | $420,100 | Net lands just under the model average. Past this the buyer is paying more than the evidence supports. |