For use by ALEX Agents and Clients only. Sharing this report or its information with any third party without ALEX’s express written consent is prohibited and subjects the disclosing party to legal action.
© 2026 ALEX. All rights reserved.ALEX · Executive Summary
408 Ridgetop Bend, Cedar Park
Comparable-sales valuation · Valuation · Williamson County
The detailed report: https://alex-companies.com/valuations/buyer-listed/408-ridgetop-bnd-cedar-park-tx--canonical.html
Every
calculation, comparable sale and source behind this summary, always the current version.
This executive summary: https://alex-companies.com/valuations/buyer-listed/408-ridgetop-bnd-cedar-park-tx--executive-summary.html
The
permanent link to this summary, always the current version.
01What the evidence says this house is worth
Both models start from the same sales. But at that point they dramatically differ.
ALEX Model
Minimum
Average
Median
Maximum
The ALEX Model uses five comparable sales. Each sale’s adjusted price is carried to this home’s 4,191 SF using the size effect measured from 7,044 recent sales in the ABOR market: resales priced $1,000,000 and up, closed since July 2023. Each sale is then weighted by how closely it matches this home on size, age, lot, rooms, distance and date of sale. The average and median are weighted; the minimum and maximum are the lowest and highest single sale. The minimum is held at $1,034,100, 90% of the $1,149,000 last list price. The lowest single sale indicates $967,808.
Standard Arithmetic Model
Minimum
Average
Median
Maximum
The same five sales, with no adjustments: the average sale price per SF times this home’s 4,191 SF, every sale counted equally. Section 02 explains how the two Models differ.
02How the two Models differ
Standard Arithmetic Model. The math is simple:
- Sale Price per SF for Each Home Used as a Comparable Sale. For each home used as a comparable sale, divide its sale price by its total SF.
- Average Sale Price per SF. Add the Sale Price per SF for Each Home, then divide by the number of homes.
- Your Home’s SF. Use the SF on the MLS listing, the same source as every comparable sale.
- Your Home’s Estimated Value. Average Sale Price per SF multiplied by Your Home’s SF.
Example. $200 (Average Sale Price per SF) × 2,500 SF (Your Home’s SF) = $500,000 (Your Home’s Estimated Value).
ALEX Model. It is statistically sound and accurate:
- Comparable Sales. Closed sales like Your Home, chosen by ALEX’s selection rules or by the agent.
- Net Sale Price for Each Home Used as a Comparable Sale. Its sale price less the closing costs and repairs the seller paid, as recorded in the MLS.
- Time Adjustment. Each net sale price is brought to today with ALEX’s repeat-sales index for the county.
- Feature Adjustments. Each difference from Your Home — bathrooms, garage, lot size, view, age and the rest — is priced at what ABOR closed sales in the same price range show the market pays.
- Price per SF. Each adjusted price is divided by the sale’s own SF.
- At Your Home’s Size. That price per SF is multiplied by Your Home’s SF, then corrected because larger homes sell for less per SF, as measured on the market.
- Weighting. Sales most like Your Home count for more, whether ALEX or the agent selected them. Each sale’s weight is shown in the report.
- Your Home’s Estimated Value. The weighted average of the sales (a plain average when they count equally), with the minimum, median and maximum beside it.
How one sale becomes a value: 204 Broken Arrow Dr
This sale says this home is worth $967,808 and carries 26.8% of the weight, the most of the five sales, because it is the closest match. Every sale goes through the same steps. The weighted average of all five is $1,073,282. That is ALEX’s valuation.
How much each sale counts
| 204 Broken Arrow Dr | $967,808 | 26.8% |
| 305 Stiles Cv | $1,067,448 | 24.0% |
| 402 Raging River Rd | $1,204,622 | 19.0% |
| 4115 Percheron Bnd | $1,109,458 | 17.3% |
| 401 Bluff View Rd | $1,061,297 | 12.9% |
| Weighted average | $1,073,282 | 100% |
Each slice is one sale’s share of the valuation. The closer a sale is to this home on the seven measures of similarity, the bigger its slice. The dollar figure is what that sale says this home is worth. Each one is multiplied by its share, and the results add up to the weighted average.
ALEX Model valuation is $21,470 lower than the Standard Arithmetic Model — 2.0% lower.
ALEX Model
Standard Arithmetic Model
The ALEX Model is
lower
The ALEX Model is
lower
03How the comparable sales are chosen
04Appendix: summary of comparable properties
All five are in Ranch At Brushy Creek, this house’s own subdivision. In each table the first column is this house and each column after it is one comparable sale. Dollar amounts are rounded to the nearest dollar, and each total is the sum of the lines shown above it.
The house
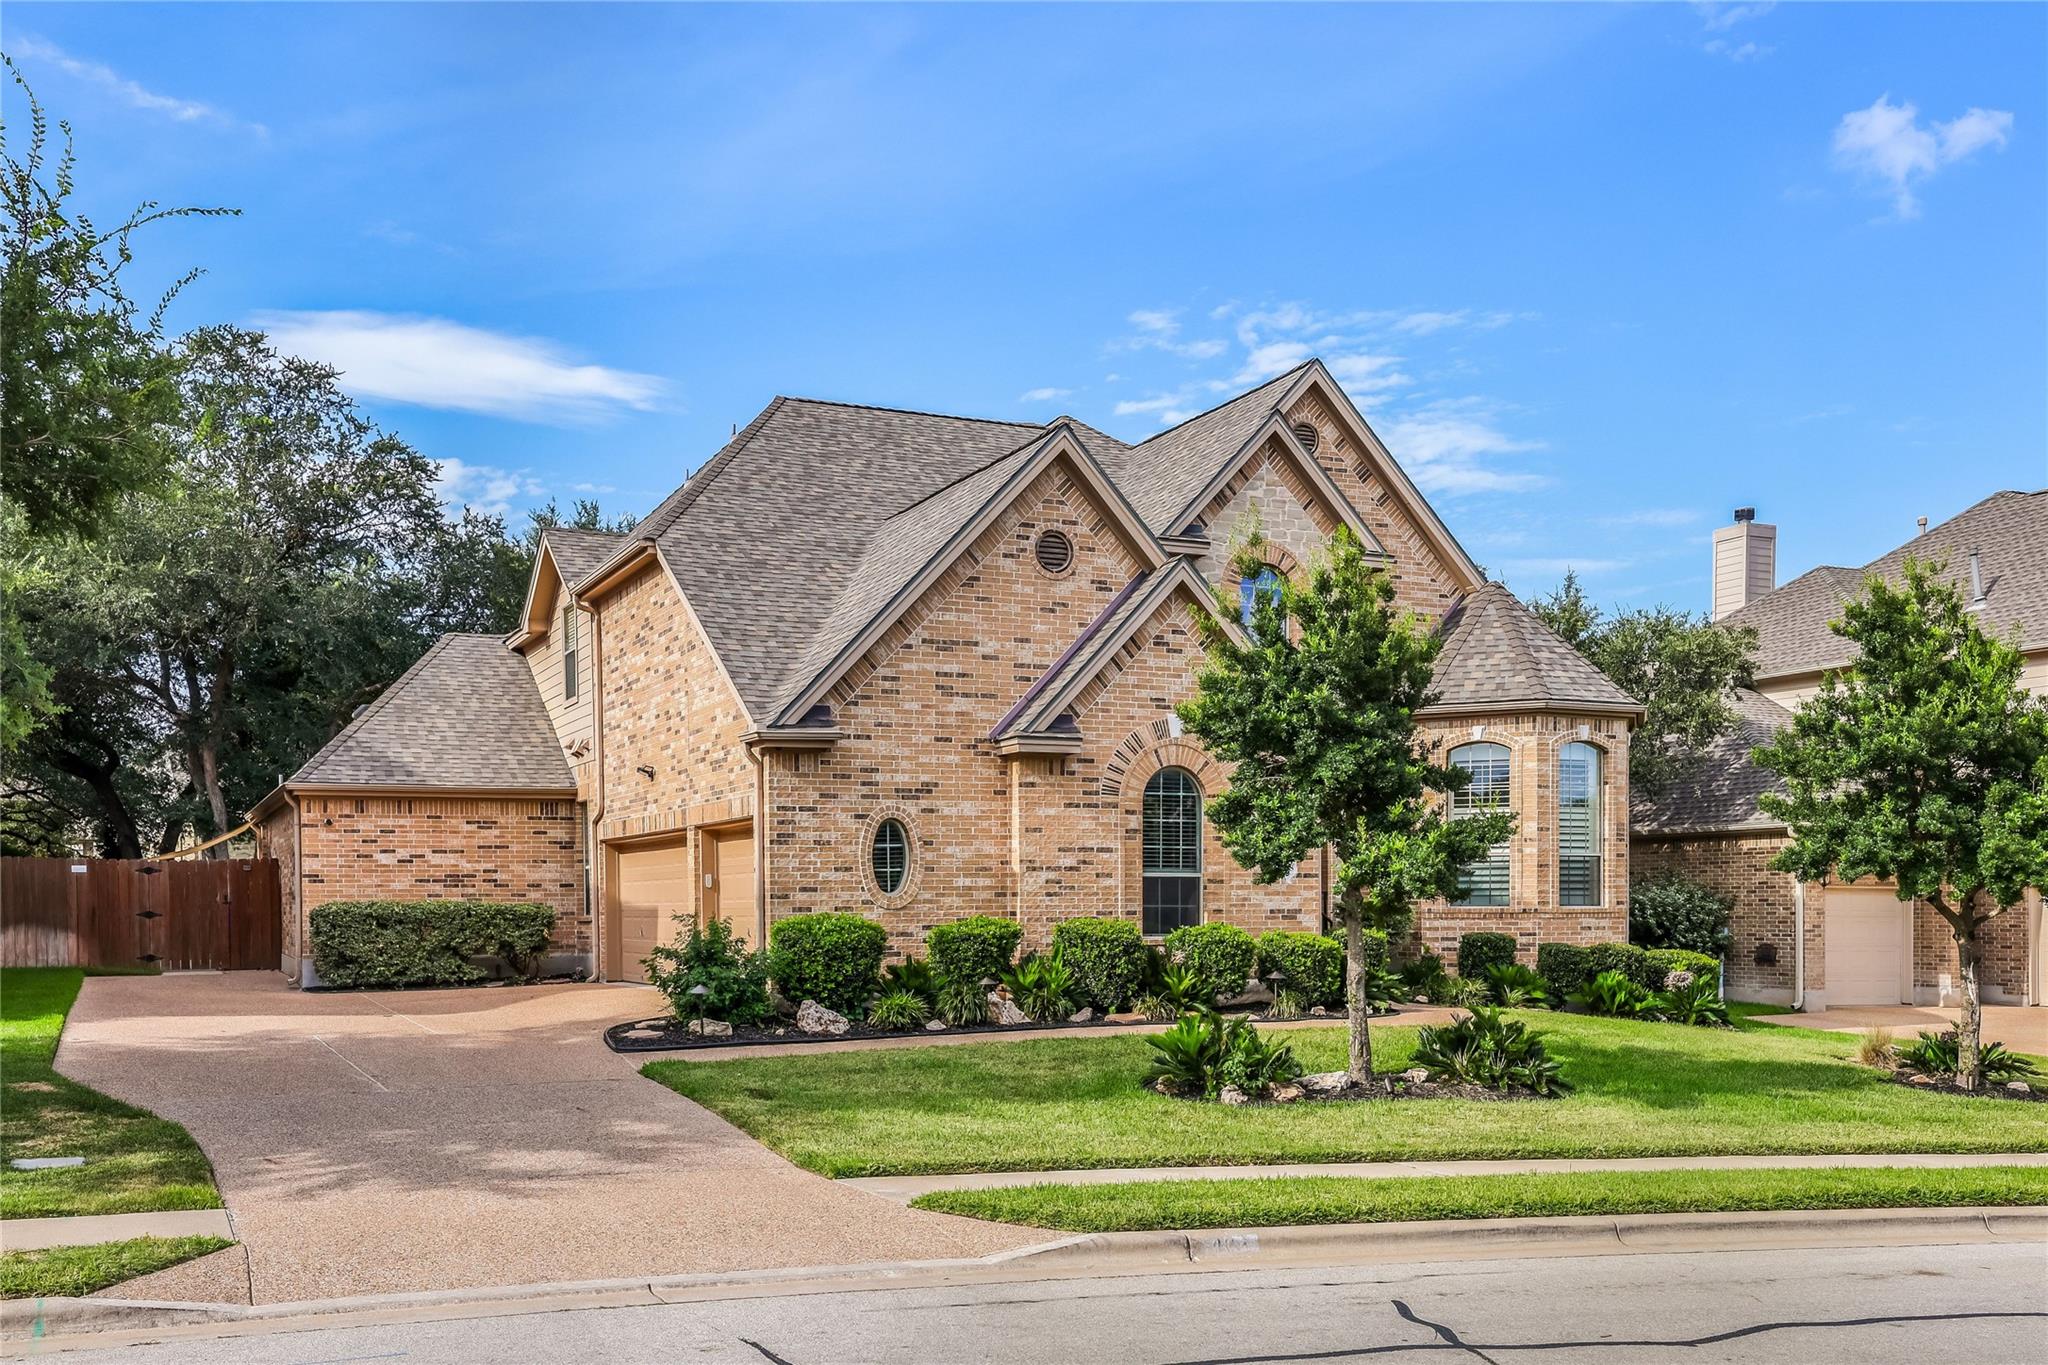 408 Ridgetop BndThis houseMLS # 7709324 | 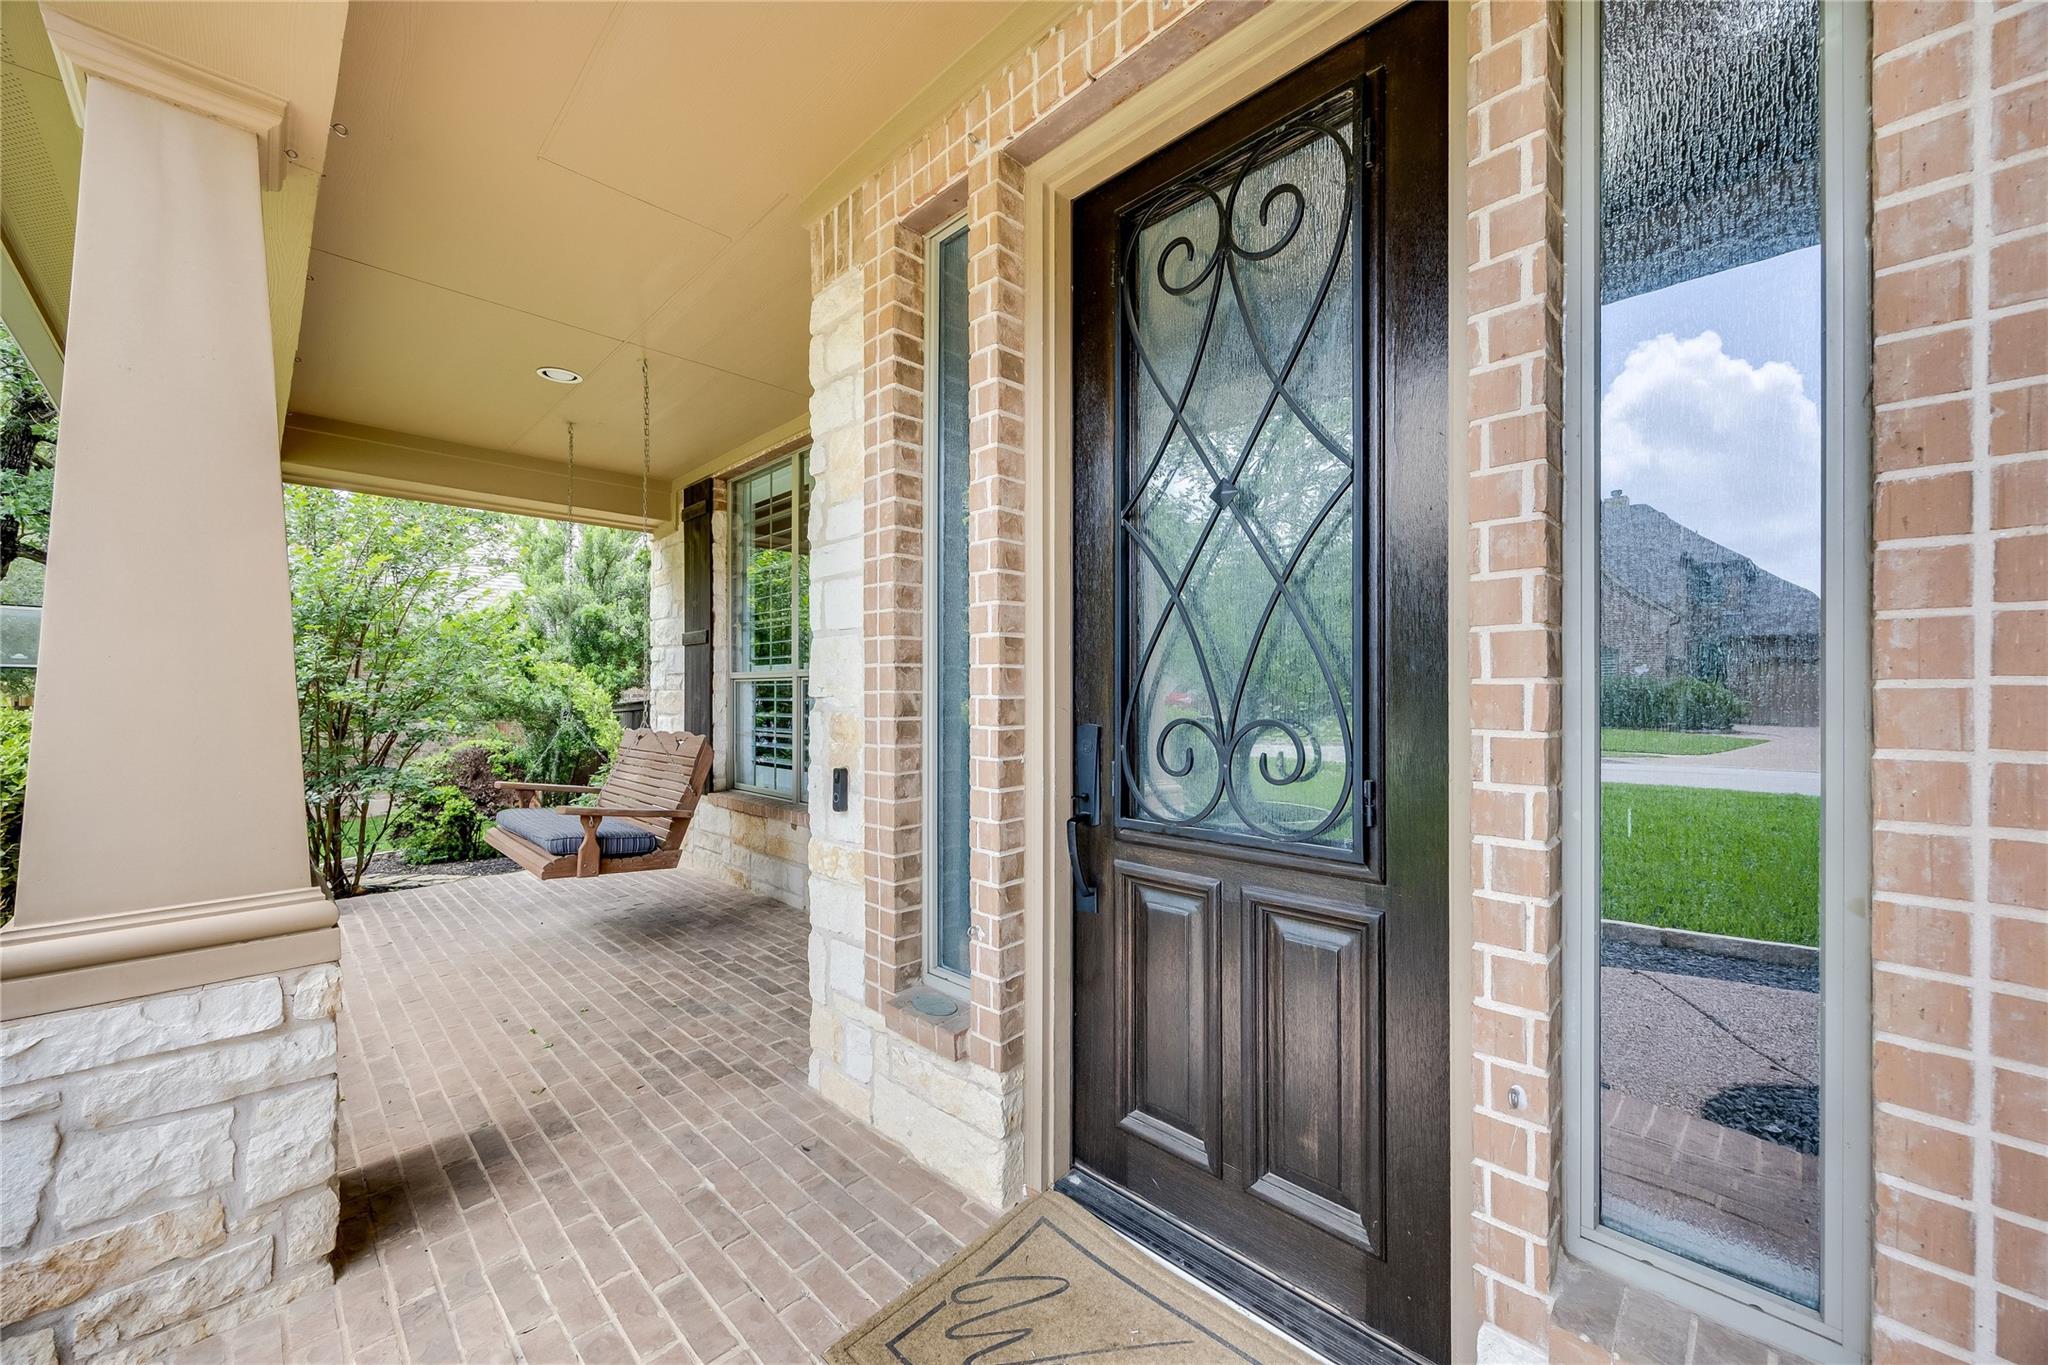 204 Broken Arrow DrSale 1MLS # 7120704 | 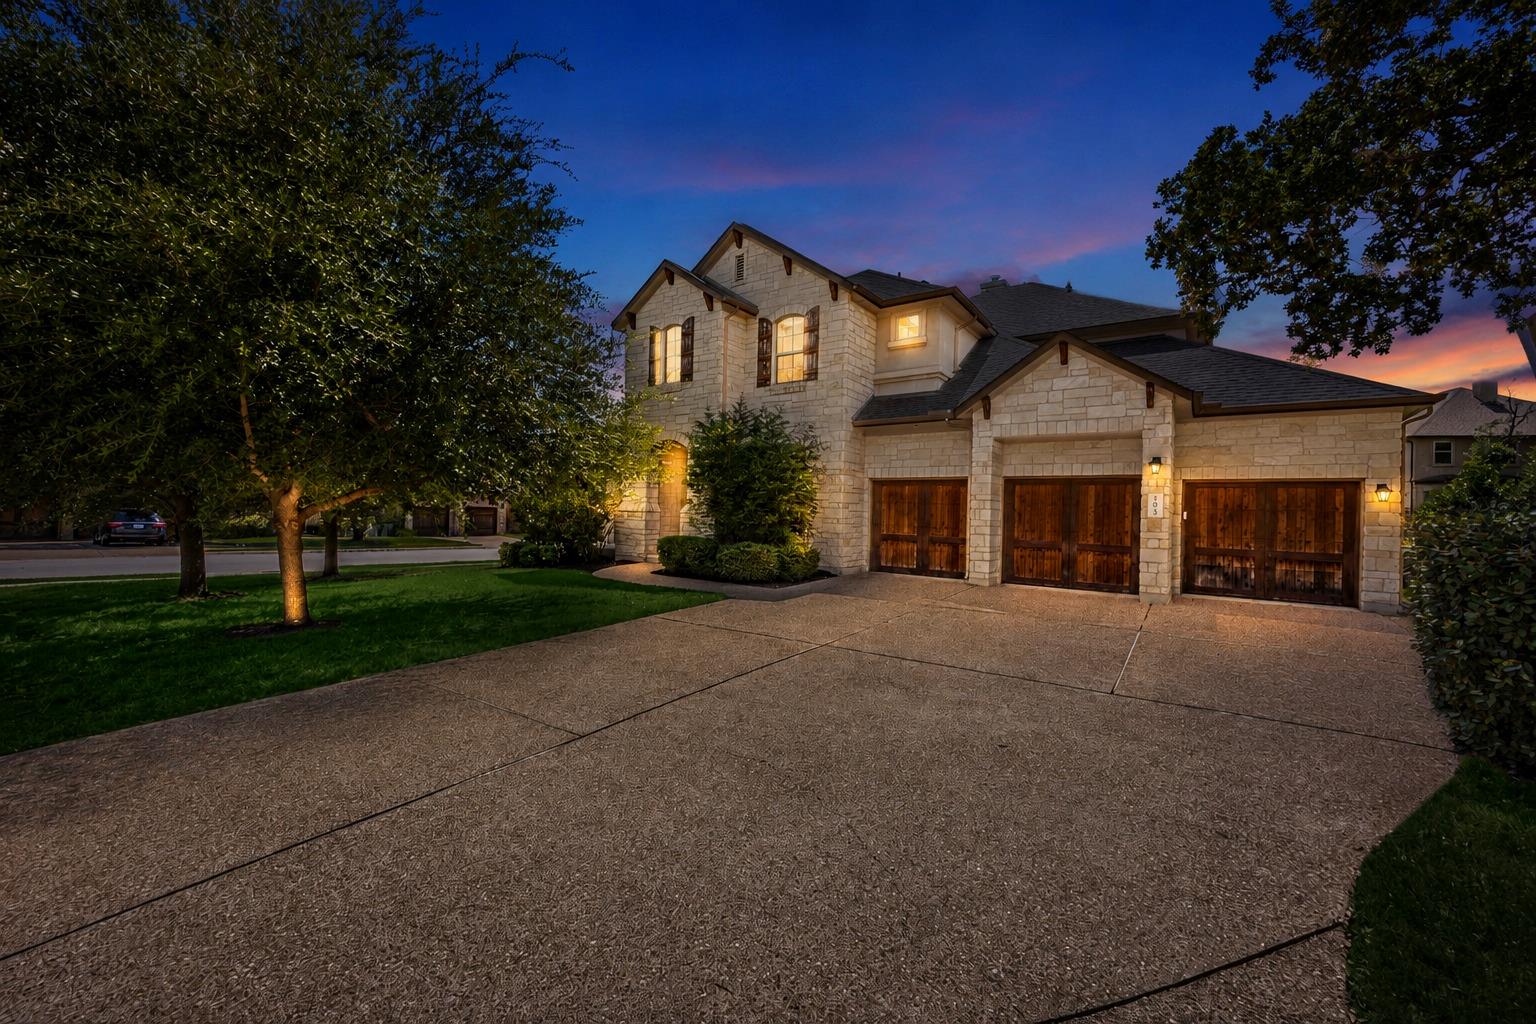 305 Stiles CvSale 2MLS # 7236573 | 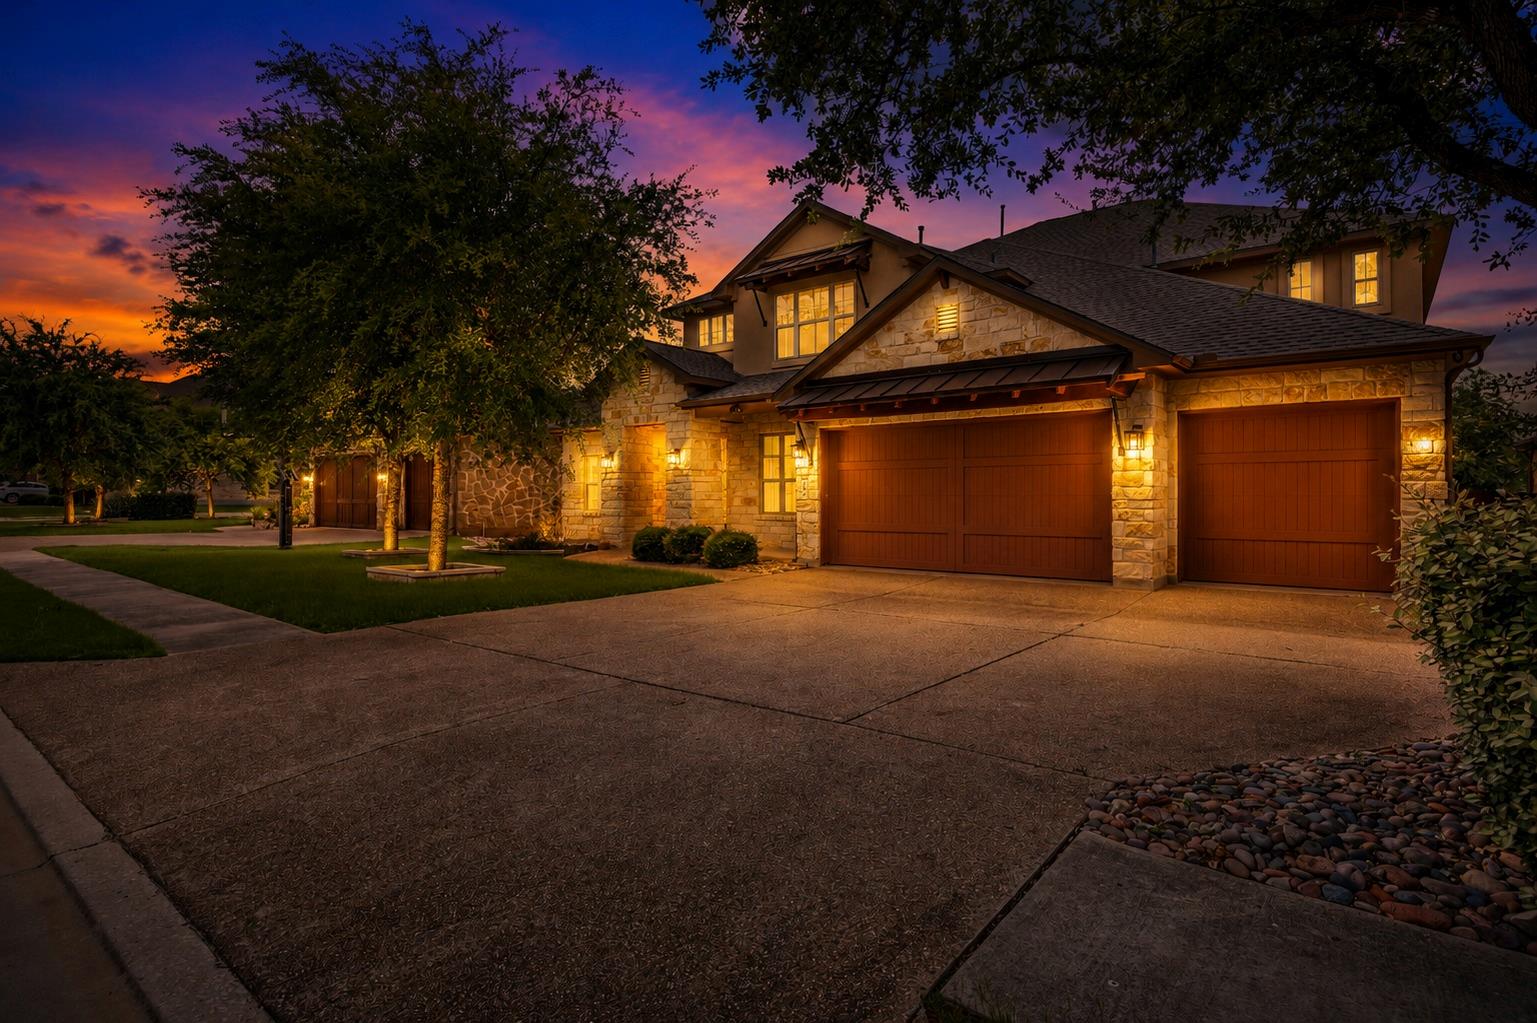 402 Raging River RdSale 3MLS # 1521986 | 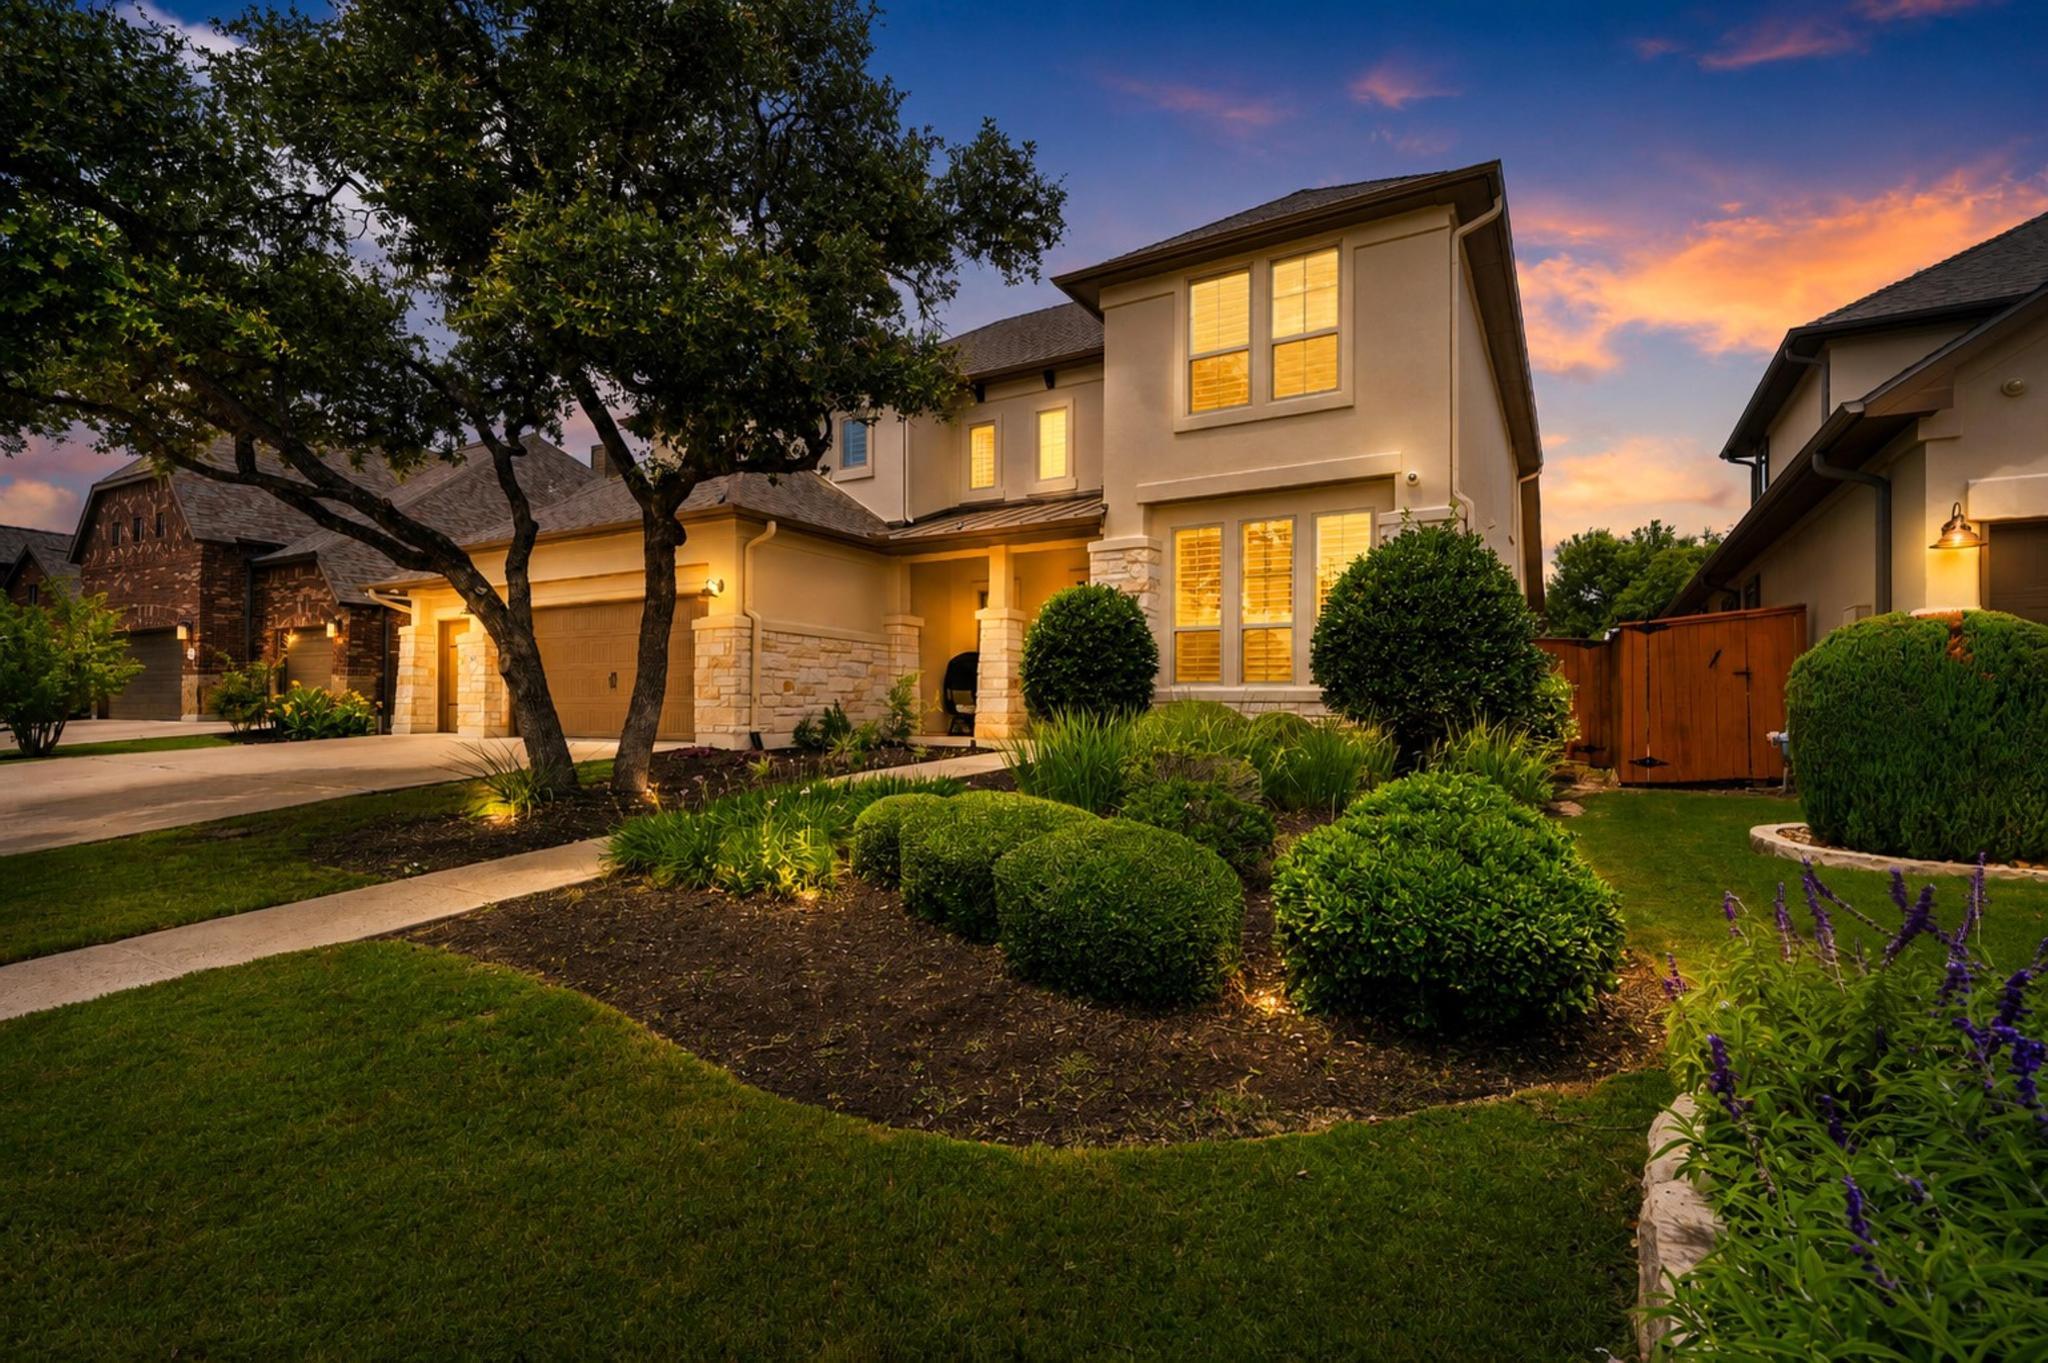 4115 Percheron BndSale 4MLS # 8883258 | 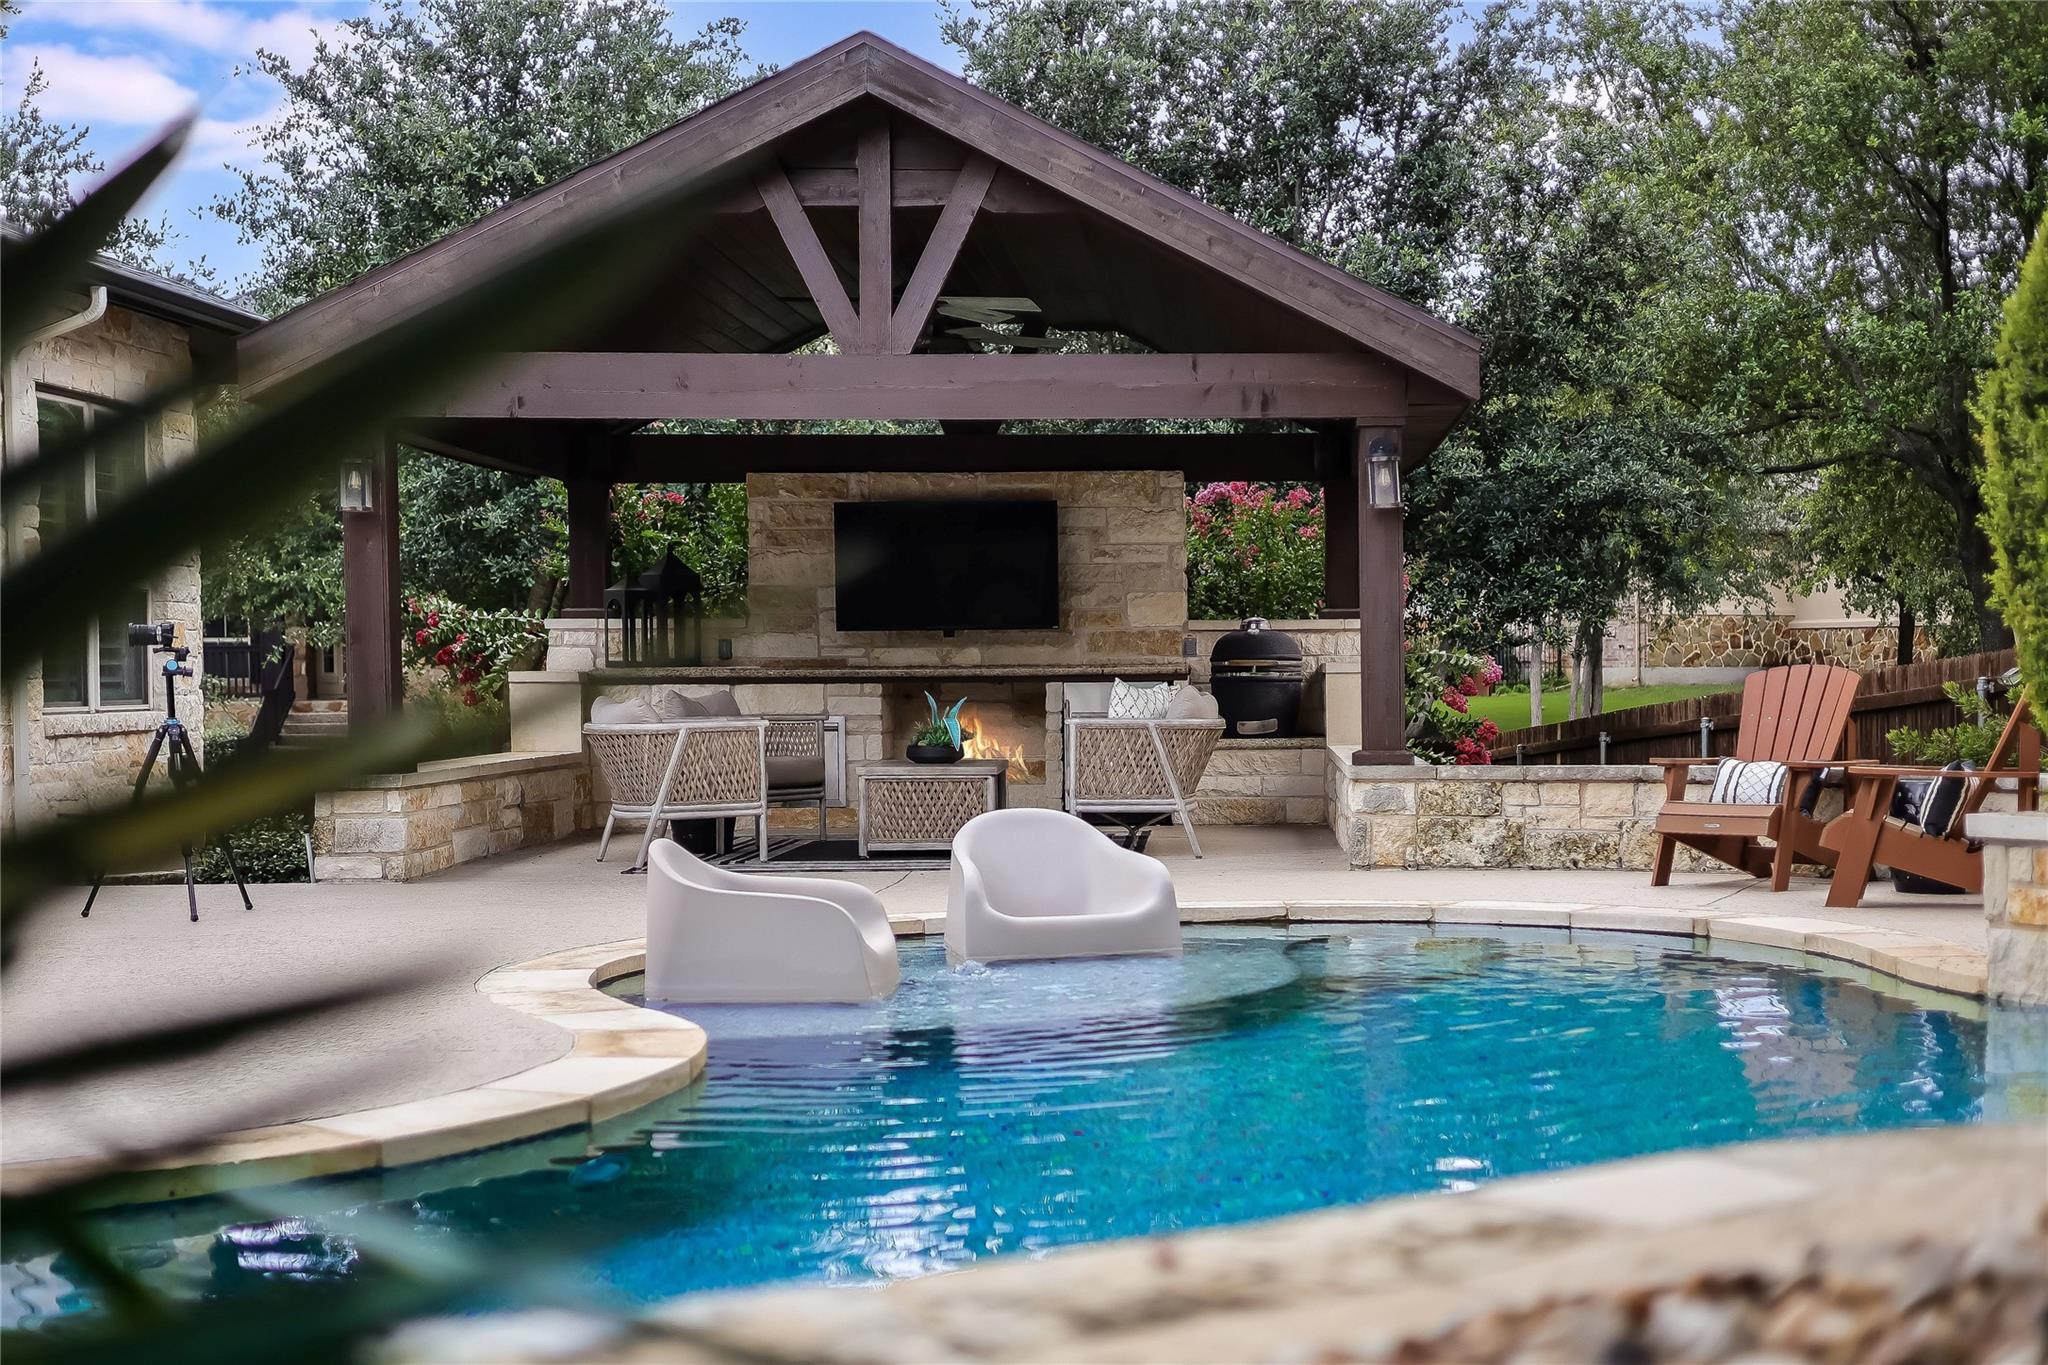 401 Bluff View RdSale 5MLS # 4065194 | |
|---|---|---|---|---|---|---|
| Distance from this house | — | 0.63 mi N | 0.51 mi ENE | 0.48 mi E | 0.26 mi ENE | 0.74 mi N |
| Living area | 4,191 SF | 4,050 SF | 3,828 SF | 4,700 SF | 4,760 SF | 3,823 SF |
| Bedrooms | 4 | 4 | 4 | 5 | 5 | 5 |
| Bathrooms | 3.1 | 3.1 | 4 | 4 | 5.1 | 4 |
| Year built | 2007 | 2008 | 2014 | 2014 | 2015 | 2008 |
| Lot area | 9,910 SF | 12,153 SF | 12,053 SF | 8,847 SF | 9,178 SF | 16,740 SF |
| Garage | 3-car | 3-car | 3-car | 3-car | 3-car | 3-car |
| Levels | Two | Two | Two | Two | Two | Two |
The sale
| 408 Ridgetop BndThis houseMLS # 7709324 | 204 Broken Arrow DrSale 1MLS # 7120704 | 305 Stiles CvSale 2MLS # 7236573 | 402 Raging River RdSale 3MLS # 1521986 | 4115 Percheron BndSale 4MLS # 8883258 | 401 Bluff View RdSale 5MLS # 4065194 | |
|---|---|---|---|---|---|---|
| Listing date | 07/09/26 | 04/24/26 | 07/07/26 | 06/13/26 | 05/23/26 | 06/19/26 |
| Close date | Withdrawn | 06/25/26 | 08/21/26 | 07/31/26 | 08/20/26 | 10/02/26 |
| Days on market | 102 | 25 | 3 | 14 | 56 | 81 |
| Original list price | $1,195,000 | $1,150,000 | $1,030,000 | $1,286,000 | $1,285,000 | $1,195,000 |
| Last list price | $1,149,000 | $1,049,000 | $1,030,000 | $1,286,000 | $1,245,000 | $1,144,000 |
| Closed price | — | $1,015,000 | $999,999 | $1,256,000 | $1,170,000 | $1,075,000 |
| Buyer closing costs paid by the seller | — | −$2,000 | — | — | −$3,000 | −$6,000 |
| Repairs at the buyer’s request | — | — | −$3,000 | — | — | — |
| Net sale price | — | $1,013,000 | $996,999 | $1,256,000 | $1,167,000 | $1,069,000 |
Time adjustment
| Months from sale to today | — | 4 months | 2 months | 3 months | 2 months | 0 months |
|---|---|---|---|---|---|---|
| Market trend to today | — | −$32,355 | −$7,661 | −$31,876 | −$8,967 | — |
| Time-adjusted net sale price | — | $980,645 | $989,338 | $1,224,124 | $1,158,033 | $1,069,000 |
| Per SF | — | $242 | $258 | $260 | $243 | $280 |
ALEX Model & Diane Adjustments
| 408 Ridgetop BndThis houseMLS # 7709324 | 204 Broken Arrow DrSale 1MLS # 7120704 | 305 Stiles CvSale 2MLS # 7236573 | 402 Raging River RdSale 3MLS # 1521986 | 4115 Percheron BndSale 4MLS # 8883258 | 401 Bluff View RdSale 5MLS # 4065194 | |
|---|---|---|---|---|---|---|
| Age | — | −$2,058 | −$14,995 | −$18,589 | −$19,888 | −$2,220 |
| Back yard | — | — | — | — | — | — |
| Bathrooms | — | — | — | — | — | — |
| Bedroom count | — | — | — | — | — | — |
| Casita | — | — | — | — | — | — |
| Corner lot | — | — | +$7,486 | — | — | +$7,757 |
| Cul-de-sac | — | — | — | — | — | — |
| Deck | — | — | — | — | — | — |
| Exterior condition | — | — | — | — | — | — |
| Fence | — | — | — | — | — | — |
| Fireplace | — | — | — | — | — | — |
| Flood plain | — | — | — | — | — | — |
| Foundation | — | — | — | — | — | — |
| Front yard | — | — | — | — | — | — |
| Full bath | — | — | −$27,688 | −$34,325 | −$64,266 | −$28,691 |
| Full bath 2 | — | — | — | — | — | — |
| Full bath 3 | — | — | — | — | — | — |
| Garage | — | — | — | — | — | — |
| Guest suite | — | — | — | — | — | — |
| Half bath | — | — | +$12,346 | +$15,305 | — | +$12,793 |
| Interior lighting | — | — | — | — | — | — |
| Interior quality | — | — | — | — | — | — |
| Kitchen | — | — | — | — | — | — |
| Lot size | — | −$15,128 | −$15,110 | +$10,854 | +$6,871 | −$41,928 |
| Outbuilding | — | — | — | — | — | — |
| Outdoor kitchen | — | — | — | — | — | — |
| Patio | — | — | +$6,734 | — | +$7,815 | — |
| Pool | — | — | +$76,564 | +$94,914 | +$88,854 | — |
| Primary bath | — | — | — | — | — | — |
| Septic | — | — | — | — | — | — |
| Solar | — | — | — | — | — | — |
| Stories | — | — | — | — | — | — |
| Study office | — | −$10,996 | −$11,447 | — | — | — |
| Updated or remodeled | — | — | — | — | — | — |
| View | — | — | — | −$21,421 | — | — |
| Visible disrepair | — | — | — | — | — | — |
| Well | — | — | — | — | — | — |
| Total ALEX Model & Diane adjustments | — | −$28,182 | +$33,890 | +$46,738 | +$19,386 | −$52,289 |
Size adjustment
| 408 Ridgetop BndThis houseMLS # 7709324 | 204 Broken Arrow DrSale 1MLS # 7120704 | 305 Stiles CvSale 2MLS # 7236573 | 402 Raging River RdSale 3MLS # 1521986 | 4115 Percheron BndSale 4MLS # 8883258 | 401 Bluff View RdSale 5MLS # 4065194 | |
|---|---|---|---|---|---|---|
| Scaling to 4,191 SF | — | +$33,160 | +$97,030 | −$137,632 | −$140,746 | +$97,868 |
| Statistical size adjustment | — | −$17,815 | −$52,810 | +$71,392 | +$72,785 | −$53,282 |
| Total size adjustment | — | +$15,345 | +$44,220 | −$66,240 | −$67,961 | +$44,586 |
Scaling to 4,191 SF. The homes that sold vary in size relative to this one. To compare them fairly, each sale’s price is first restated at this home’s size, using the sale’s own price per SF. For example, 204 Broken Arrow Dr has 4,050 SF. Its price after the time adjustment and all feature adjustments, including any made by Diane, is $952,463. Restated at this home’s size: $952,463 × 4,191 ÷ 4,050 = $985,623. The scaling line for 204 Broken Arrow Dr is the difference, +$33,160.
Statistical size adjustment. Scaling at a sale’s own price per SF assumes that price per SF stays the same as size changes. It does not. Smaller homes usually sell for more per SF than larger ones. Every home has a kitchen, bathrooms and a lot, and those cost about the same whatever its size. Scaling alone therefore overstates the value of a sale smaller than this home and understates the value of a larger one. Five sales are too few to measure reliably how price per SF changes with size, so ALEX measured it from 7,044 sales in the ABOR market: resales priced $1,000,000 and up, closed since July 2023, holding age, lot, rooms and date of sale constant, and applies that correction to each sale. For 204 Broken Arrow Dr the statistical size adjustment is −$17,815, so its total size adjustment is +$15,345. The further a sale’s size is from this home’s, the larger the correction.
Final valuation
| 408 Ridgetop BndThis houseMLS # 7709324 | 204 Broken Arrow DrSale 1MLS # 7120704 | 305 Stiles CvSale 2MLS # 7236573 | 402 Raging River RdSale 3MLS # 1521986 | 4115 Percheron BndSale 4MLS # 8883258 | 401 Bluff View RdSale 5MLS # 4065194 | |
|---|---|---|---|---|---|---|
| Net sale price | — | $1,013,000 | $996,999 | $1,256,000 | $1,167,000 | $1,069,000 |
| Time adjustment | — | −$32,355 | −$7,661 | −$31,876 | −$8,967 | — |
| Time-adjusted net sale price | — | $980,645 | $989,338 | $1,224,124 | $1,158,033 | $1,069,000 |
| ALEX Model & Diane adjustments | — | −$28,182 | +$33,890 | +$46,738 | +$19,386 | −$52,289 |
| Adjusted value | — | $952,463 | $1,023,228 | $1,270,862 | $1,177,419 | $1,016,711 |
| Size adjustment | — | +$15,345 | +$44,220 | −$66,240 | −$67,961 | +$44,586 |
| Final adjusted value | — | $967,808 | $1,067,448 | $1,204,622 | $1,109,458 | $1,061,297 |
| Final adjusted sale price per SF | — | $231 | $255 | $287 | $265 | $253 |