For use by ALEX Agents and Clients only. Sharing this report or its information with any third party without ALEX’s express written consent is prohibited and subjects the disclosing party to legal action.
© 2026 ALEX. All rights reserved.ALEX · Executive Summary
109 Leon Loop, Liberty Hill
Comparable-sales valuation · Expired Property Seller Model · Williamson County
The detailed report: https://alex-companies.com/valuations/seller-expired/109-leon-loop-liberty-hill-tx--canonical.html
Every
calculation, comparable sale and source behind this summary, always the current version.
This executive summary: https://alex-companies.com/valuations/seller-expired/109-leon-loop-liberty-hill-tx--executive-summary.html
The
permanent link to this summary, always the current version.
Recommended list price
It combines the ALEX Model and the ALEX Slotting Tool. The valuation model reads the comparable sales. The slotting tool sets the price just under a common search price and the nearest competing listing, and under the price the market already declined.
Three figures, one story. The valuation, $593,272, is what the comparable sales say this home is worth, net of concessions. The sale price, $597,000, is that value with the buyer’s closing costs and repairs sellers here customarily pay added back. The recommended list price is where to ask.
If you want to discuss the recommended list price, contact Diane (your agent).
The listing that did not sell
| Date | List price | Reduction | |
|---|---|---|---|
| Original list price | 06/22/2026 | $739,900 | — |
| Reduced to | 07/03/2026 | $719,900 | −$20,000 (2.7%) |
| Reduced to | 07/22/2026 | $724,900 | −$5,000 (0.7%) |
| Reduced to | 07/24/2026 | $714,900 | −$10,000 (1.4%) |
| Reduced to | 08/20/2026 | $699,900 | −$15,000 (2.1%) |
| Last list price | 09/22/2026 | $649,900 | −$50,000 (7.1%) |
| Total reductions | −$90,000 (12.2%) |
01What the evidence says this house is worth
Both models start from the same sales. But at that point they dramatically differ.
ALEX Model
Minimum
Average
Median
Maximum
The ALEX Model uses five comparable sales. Each sale’s adjusted price is carried to this home’s 3,316 SF using the size effect measured from 15,182 recent sales in the ABOR market: resales priced $600,000 to $1,000,000, closed since July 2023. Each sale is then weighted by how closely it matches this home on size, age, lot, rooms, distance and date of sale. The average and median are weighted; the minimum and maximum are the lowest and highest single sale. The minimum is held at $584,910, 90% of the $649,900 last list price. The lowest single sale indicates $563,227.
Standard Arithmetic Model
Minimum
Average
Median
Maximum
The same five sales, with no adjustments: the average sale price per SF times this home’s 3,316 SF, every sale counted equally. Section 02 explains how the two Models differ.
02How the two Models differ
Standard Arithmetic Model. The math is simple:
- Sale Price per SF for Each Home Used as a Comparable Sale. For each home used as a comparable sale, divide its sale price by its total SF.
- Average Sale Price per SF. Add the Sale Price per SF for Each Home, then divide by the number of homes.
- Your Home’s SF. Use the SF on the MLS listing, the same source as every comparable sale.
- Your Home’s Estimated Value. Average Sale Price per SF multiplied by Your Home’s SF.
Example. $200 (Average Sale Price per SF) × 2,500 SF (Your Home’s SF) = $500,000 (Your Home’s Estimated Value).
ALEX Model. It is statistically sound and accurate:
- Comparable Sales. Closed sales like Your Home, chosen by ALEX’s selection rules or by the agent.
- Net Sale Price for Each Home Used as a Comparable Sale. Its sale price less the closing costs and repairs the seller paid, as recorded in the MLS.
- Time Adjustment. Each net sale price is brought to today with ALEX’s index.
- Feature Adjustments. Each difference from Your Home — bathrooms, garage, lot size, view, age and the rest — is priced at what ABOR closed sales in the same price range show the market pays.
- Price per SF. Each adjusted price is divided by the sale’s own SF.
- At Your Home’s Size. That price per SF is multiplied by Your Home’s SF, then corrected because larger homes sell for less per SF, as measured on the market.
- Weighting. Sales most like Your Home count for more, whether ALEX or the agent selected them. Each sale’s weight is shown in the report.
- Your Home’s Estimated Value. The weighted average of the sales (a plain average when they count equally), with the minimum, median and maximum beside it.
How one sale becomes a value: 216 Rieti Pkwy
This sale says this home is worth $597,002 and carries 25.7% of the weight, the most of the five sales, because it is the closest match. Every sale goes through the same steps. The weighted average of all five is $593,272. That is ALEX’s valuation.
How much each sale counts
| 216 Rieti Pkwy | $597,002 | 25.7% |
| 117 Rosa Dr | $563,227 | 25.4% |
| 504 Leon Loop | $613,052 | 23.7% |
| 104 Leon Loop | $577,482 | 13.4% |
| 109 Mark Way | $628,027 | 11.8% |
| Weighted average | $593,272 | 100% |
Each slice is one sale’s share of the valuation. The closer a sale is to this home on the seven measures of similarity, the bigger its slice. The dollar figure is what that sale says this home is worth. Each one is multiplied by its share, and the results add up to the weighted average.
ALEX Model valuation is $36,592 lower than the Standard Arithmetic Model — 5.8% lower.
ALEX Model
Standard Arithmetic Model
The ALEX Model is
lower
The ALEX Model is
lower
03How the comparable sales are chosen
04Where to price it
Slotting against competitors
84 competing homes for sale in Santa Rita Ranch South and the subdivisions that share its name, from the highest list price to the lowest. The gold row at the top is this home at the recommended list price.
| Address | CDOM | Original list | Current list | Reduction | SF | Current list $/SF |
|---|---|---|---|---|---|---|
| 109 Leon Loop (this home) | — | — | $580,900 | — | 3,316 | $175 |
| 117 La Ventana Dr | 54 | $1,449,000 | $1,449,000 | None | 3,898 | $372 |
| 410 Jates Field Bnd | 12 | $1,249,900 | $1,248,900 | $1,000 · 0.1% | 5,240 | $238 |
| 506 Clima Ct | 92 | $1,256,900 | $1,174,900 | $82,000 · 6.5% | 4,411 | $266 |
| 121 La Ventana Dr | 384 | $1,249,000 | $1,139,000 | $110,000 · 8.8% | 3,465 | $329 |
| 213 Jates Field Bnd | 184 | $1,299,900 | $1,074,900 | $225,000 · 17.3% | 4,891 | $220 |
| 268 Jates Field Bnd | 222 | $975,035 | $999,250 | None | 3,709 | $269 |
| 260 Jates Field Bnd | 236 | $1,115,150 | $998,260 | $116,890 · 10.5% | 4,488 | $222 |
| 401 Jates Field Bnd | 155 | $962,114 | $997,844 | None | 3,709 | $269 |
| 316 Valletta Way | 576 | $939,900 | $894,900 | $45,000 · 4.8% | 4,048 | $221 |
| 100 Irvine Pass | 127 | $886,990 | $818,990 | $68,000 · 7.7% | 4,108 | $199 |
| 101 Leon Loop | 55 | $845,625 | $729,438 | $116,187 · 13.7% | 3,792 | $192 |
| 142 Montecilo Dr | 96 | $847,750 | $729,273 | $118,477 · 14.0% | 4,108 | $178 |
| 213 Great Lawn Bnd | 508 | $800,000 | $720,000 | $80,000 · 10.0% | 4,172 | $173 |
| 121 La Caleta Bnd | 168 | $796,990 | $718,990 | $78,000 · 9.8% | 2,872 | $250 |
| 120 Chantilly Way | 781 | $719,990 | $699,990 | $20,000 · 2.8% | 3,465 | $202 |
| 501 Great Lawn Cv | 55 | $715,000 | $698,000 | $17,000 · 2.4% | 3,437 | $203 |
| 212 Borrego Bnd | 202 | $761,080 | $674,212 | $86,868 · 11.4% | 3,032 | $222 |
| 228 Poole Ln | 105 | $685,000 | $670,000 | $15,000 · 2.2% | 3,455 | $194 |
| 305 Palatino Bnd | 20 | $660,000 | $660,000 | None | 3,496 | $189 |
| 125 Mindy Way | 757 | $655,000 | $655,000 | None | 3,332 | $197 |
| 531 Great Lawn Bnd | 124 | $719,500 | $645,000 | $74,500 · 10.4% | 3,765 | $171 |
| 793 Faith Dr | 14 | $619,000 | $619,000 | None | 3,167 | $195 |
| 117 Peacevine Ln | 466 | $645,000 | $615,000 | $30,000 · 4.7% | 3,381 | $182 |
| 213 Encore Dr | 185 | $635,000 | $614,900 | $20,100 · 3.2% | 3,009 | $204 |
| 116 Texon Dr | 119 | $610,000 | $600,000 | $10,000 · 1.6% | 3,032 | $198 |
| 128 Lockhart Dr | 125 | $599,000 | $599,000 | None | 2,773 | $216 |
| 113 Cascia Cir | 795 | $665,000 | $580,000 | $85,000 · 12.8% | 2,894 | $200 |
| 416 Amista Dr | 126 | $616,990 | $579,990 | $37,000 · 6.0% | 2,850 | $204 |
| 300 Amista Dr | 127 | $618,990 | $579,990 | $39,000 · 6.3% | 2,909 | $199 |
| 228 Amista Dr | 126 | $615,990 | $578,990 | $37,000 · 6.0% | 2,900 | $200 |
| 507 Los Aliso Ct | 125 | $630,335 | $569,900 | $60,435 · 9.6% | 2,936 | $194 |
| 237 Redonda Dr | 90 | $569,000 | $569,000 | None | 2,993 | $190 |
| 500 Palatino Bnd | 126 | $599,990 | $563,990 | $36,000 · 6.0% | 2,889 | $195 |
| 224 Rosebush Dr | 34 | $559,000 | $559,000 | None | 2,611 | $214 |
| 117 Cintilar St | 240 | $598,990 | $558,990 | $40,000 · 6.7% | 2,888 | $194 |
| 404 Amista Dr | 246 | $571,990 | $554,990 | $17,000 · 3.0% | 2,909 | $191 |
| 516 Palatino Bnd | 273 | $621,990 | $549,990 | $72,000 · 11.6% | 2,881 | $191 |
| 408 Amista Dr | 167 | $598,990 | $548,990 | $50,000 · 8.3% | 2,703 | $203 |
| 504 Palatino Bnd | 273 | $626,990 | $546,990 | $80,000 · 12.8% | 2,854 | $192 |
| 113 Azalea Springs Rd | 14 | $546,000 | $546,000 | None | 2,693 | $203 |
| 109 Coleman Bnd | 139 | $584,990 | $538,500 | $46,490 · 7.9% | 2,988 | $180 |
| 413 Daniel Xing | 12 | $534,999 | $534,999 | None | 3,413 | $157 |
| 524 Palatino Bnd | 121 | $612,990 | $531,990 | $81,000 · 13.2% | 2,850 | $187 |
| 120 Berean Ln | 113 | $535,000 | $524,900 | $10,100 · 1.9% | 2,541 | $207 |
| 171 Alicante Ln | 9 | $520,000 | $520,000 | None | 2,686 | $194 |
| 112 Ray Ct | 47 | $525,000 | $515,000 | $10,000 · 1.9% | 2,348 | $219 |
| 428 Amista Dr | 121 | $556,990 | $511,990 | $45,000 · 8.1% | 2,079 | $246 |
| 401 Daniel Xing | 140 | $500,000 | $500,000 | None | 3,737 | $134 |
| 400 Amista Dr | 167 | $564,990 | $499,990 | $65,000 · 11.5% | 2,079 | $240 |
| 813 Faith Dr | 9 | $499,500 | $499,500 | None | 2,182 | $229 |
| 309 Avendita Ln | 180 | $535,000 | $499,000 | $36,000 · 6.7% | 2,831 | $176 |
| 232 Flora Springs Cv | 58 | $549,900 | $497,900 | $52,000 · 9.5% | 2,412 | $206 |
| 100 Rangel Dr | 194 | $487,500 | $477,500 | $10,000 · 2.1% | 2,652 | $180 |
| 113 Cintilar St | 251 | $528,990 | $473,990 | $55,000 · 10.4% | 2,061 | $230 |
| 325 Amista Dr | 120 | $484,990 | $469,990 | $15,000 · 3.1% | 1,825 | $258 |
| 508 Palatino Bnd | 121 | $493,990 | $457,990 | $36,000 · 7.3% | 1,828 | $251 |
| 181 Benedum Way | 13 | $450,000 | $450,000 | None | 2,072 | $217 |
| 412 Amista Dr | 240 | $544,990 | $449,990 | $95,000 · 17.4% | 2,079 | $216 |
| 789 Faith Dr | 39 | $439,900 | $439,900 | None | 2,150 | $205 |
| 201 Double Mountain Rd | 83 | $435,000 | $435,000 | None | 2,772 | $157 |
| 825 Faith Dr | 229 | $465,000 | $435,000 | $30,000 · 6.5% | 1,983 | $219 |
| 125 Andele Way | 79 | $430,000 | $430,000 | None | 2,703 | $159 |
| 821 Faith Dr | 166 | $500,000 | $425,000 | $75,000 · 15.0% | 2,248 | $189 |
| 208 Dycus Bnd | 15 | $424,900 | $424,900 | None | 2,785 | $153 |
| 520 Palatino Bnd | 273 | $514,990 | $414,990 | $100,000 · 19.4% | 1,805 | $230 |
| 113 Mindy Way | 132 | $449,900 | $414,900 | $35,000 · 7.8% | 2,383 | $174 |
| 108 Normal School Way | 89 | $425,000 | $400,000 | $25,000 · 5.9% | 2,540 | $157 |
| 219 Flora Springs Cv | 57 | $384,981 | $394,980 | None | 1,925 | $205 |
| 221 Flora Springs Cv | 56 | $379,915 | $389,314 | None | 1,901 | $205 |
| 225 Flora Springs Cv | 56 | $373,840 | $383,439 | None | 1,818 | $211 |
| 227 Flora Springs Cv | 50 | $362,345 | $372,144 | None | 1,710 | $218 |
| 215 Flora Springs Cv | 201 | $412,215 | $363,900 | $48,315 · 11.7% | 1,710 | $213 |
| 201 Flora Springs Cv | 198 | $398,110 | $359,120 | $38,990 · 9.8% | 1,710 | $210 |
| 112 Andele Way | 92 | $359,900 | $355,000 | $4,900 · 1.4% | 1,593 | $223 |
| 313 Redonda Dr | 189 | $394,900 | $349,999 | $44,901 · 11.4% | 2,073 | $169 |
| 404 Perryville Loop | 49 | $349,000 | $329,900 | $19,100 · 5.5% | 2,392 | $138 |
| 153 Carlina Loop | 180 | $359,000 | $329,900 | $29,100 · 8.1% | 1,661 | $199 |
| 305 Banyon Dr | 159 | $330,000 | $325,000 | $5,000 · 1.5% | 1,621 | $200 |
| 281 La Dera Dr | 45 | $315,000 | $315,000 | None | 1,610 | $196 |
| 100 Normal School Way | 21 | $315,000 | $315,000 | None | 1,465 | $215 |
| 145 Carlina Loop | 14 | $309,900 | $309,900 | None | 2,112 | $147 |
| 120 Cascata Way | 13 | $300,000 | $300,000 | None | 1,727 | $174 |
| 323 Zuma Dr | 68 | $315,000 | $299,000 | $16,000 · 5.1% | 1,540 | $194 |
| 284 Zuma Dr | 88 | $315,000 | $297,000 | $18,000 · 5.7% | 1,540 | $193 |
CDOM is cumulative days on market. SF is the living area on each MLS listing; current list $/SF is the current list price divided by it. Each address opens the listing on alex.realestate.
This report recommends one list price. For a listing relaunched with a new brokerage it sits 4% to 8% under the failed price, where relaunches did best. The sale price below is the evidence it rests on. It is not a list price.
Slotted recommended list price: $580,900. Priced just under the $600,000 search price, so buyers who filter at $600,000 see it. The nearest competing listing, 113 Cascia Cir at $580,000, is already at or below it. It is 10.6% below the failed price.
Sale price: $597,000. What the comparable sales support as a sale price, before the repairs and buyer closing costs sellers here customarily pay (0.62% of the price). It is the adjusted net value, $593,272, with those concessions added back, rounded to the nearest $1,000.
What the market has already said: this listing asked $739,900 for 11 days, $719,900 for 19 days, $724,900 for 2 days, $714,900 for 27 days, $699,900 for 33 days and $649,900 for 28 days, and expired on 10/20/26 without a sale. The earliest it can be listed again is 11/19/26, 30 days after it expired. The detailed report sets out the method, its evidence and its limits.
Relaunching after a listing that did not sell. Of 6,313 expired listings relaunched with a new brokerage, 37% of those relaunched with a 6-8% cut sold within 90 days, against 25% of those relaunched at the same price, allowing for price range, season and time off the market. Cuts of less than 4% sold measurably less often. Cuts deeper than 8% sold no faster and closed lower. The median relaunch was 3.3% below the old price and closed at 91.1% of it. The recommended $580,900 is 10.6% below the failed $649,900. Relaunches in December to February sold best (53% within 180 days); June to August sold worst (42%). These figures describe what happened; they do not prove the price or the timing caused the sale.
How similar listings sold at these prices. At the recommended list price ($580,900), closed at about 97.4% of the list price. At the sale price ($597,000), closed at about 96.8% of the list price. The chance of selling is not stated: in this county and price range it did not hold up when tested on later listings.
05Net proceeds to seller
| Line | Amount |
|---|---|
| Sale price the recommended list price | $580,900 |
| Buyer concessions customary here | −$3,575 |
| Commissions, listing and buyer’s agent | not entered |
| Owner’s title policy | −$3,156 |
| Property taxes, January 1 to closing (10/28/26) | −$11,741 |
| Mortgage payoff | not entered |
| Other closing costs | not entered |
| Net to seller before the commissions, the mortgage payoff, other closing costs, not entered | $562,428 |
The price starts at the recommended list price, $580,900.
How each line is set. Concessions are the buyer’s closing costs paid by the seller and repair credits together: the median share of the price across 61 closed sales in Santa Rita Ranch South over 24 months. A sale recording concessions above 10% of its price is left out as an entry error, because every lender caps seller concessions between 3% and 9% (no sales here). The title premium is the Texas promulgated basic premium for a policy at the sale price. Taxes prorate the year’s bill to the closing date. Commissions, the payoff and other costs are as entered, and a blank is never counted as zero. The title company’s settlement statement is the figure that governs.
Offers and counters. Judge every offer by what it nets you. That is its price less the closing costs and repair credits it asks you to pay.
- A net of at least $580,900 is at or above the recommended list price.
- $540,155 to $580,899 is below the recommended list price. Counter toward the recommended list price, in smaller steps each round.
- Below $540,155 is below the evidence.
A credit lowers your net by its full amount. Where a buyer needs one, raising the price by the same amount keeps your net, within what the buyer’s loan and the appraisal allow.
06Appendix: summary of comparable properties
All five are in Santa Rita Ranch South, this house’s own subdivision. In each table the first column is this house and each column after it is one comparable sale. Dollar amounts are rounded to the nearest dollar, and each total is the sum of the lines shown above it.
The house
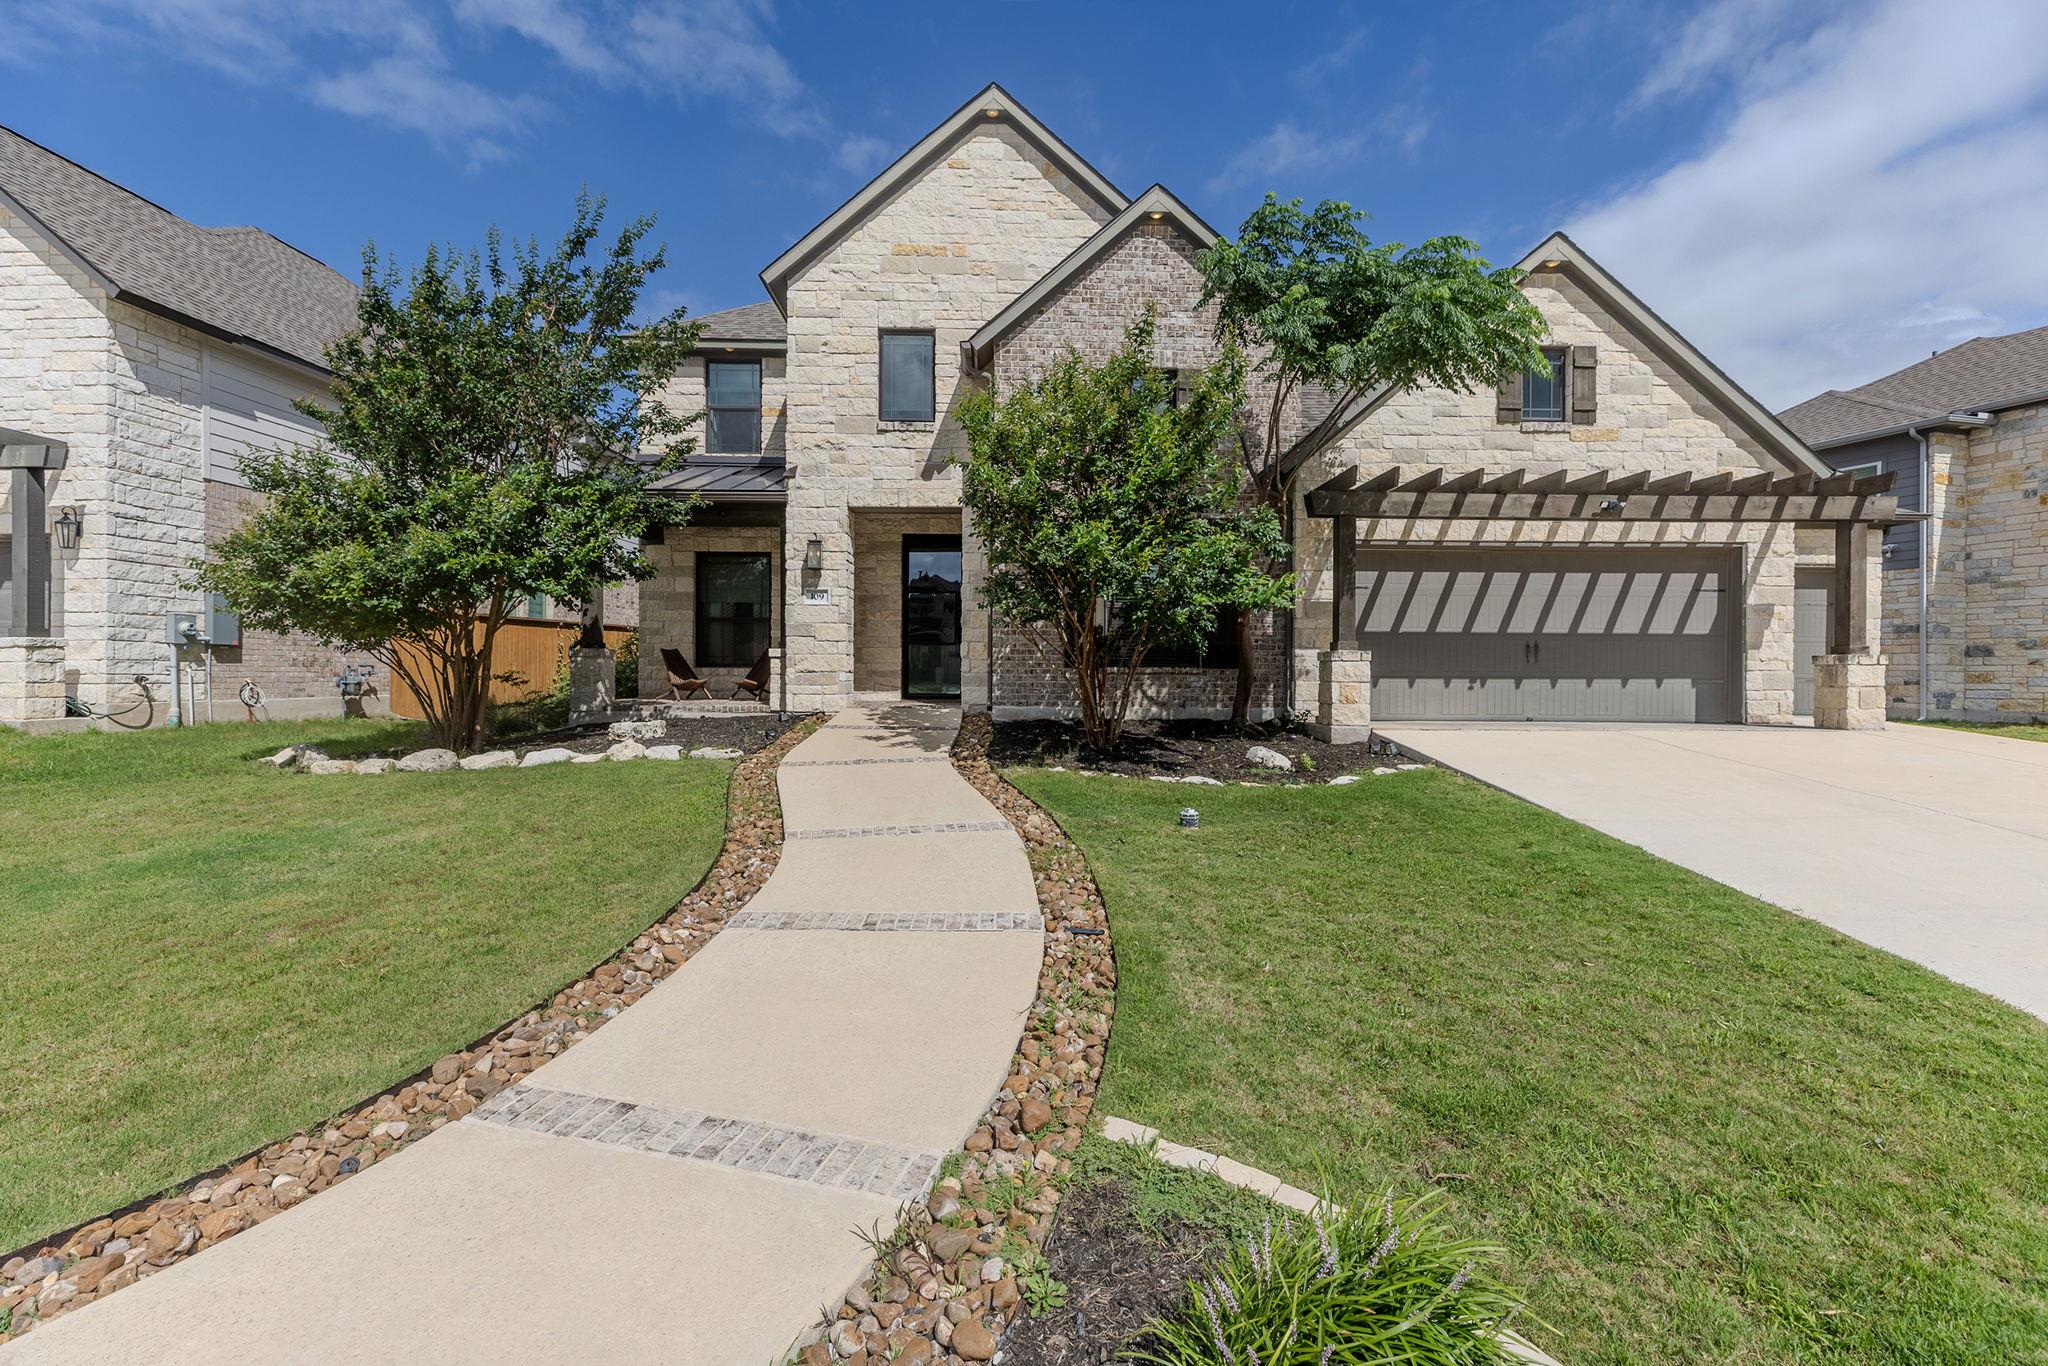 109 Leon LoopThis houseMLS # 8502031 | 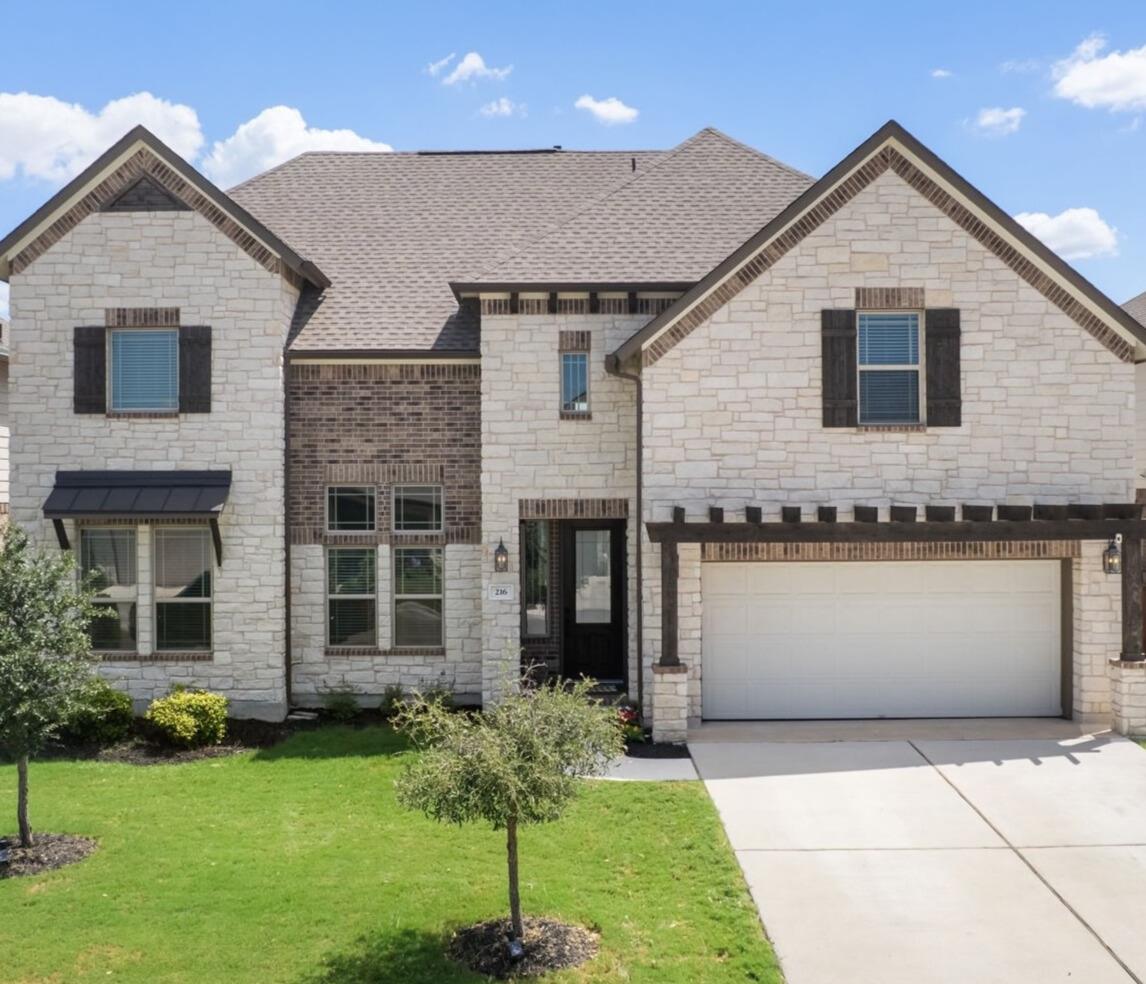 216 Rieti PkwySale 1MLS # 9612655 | 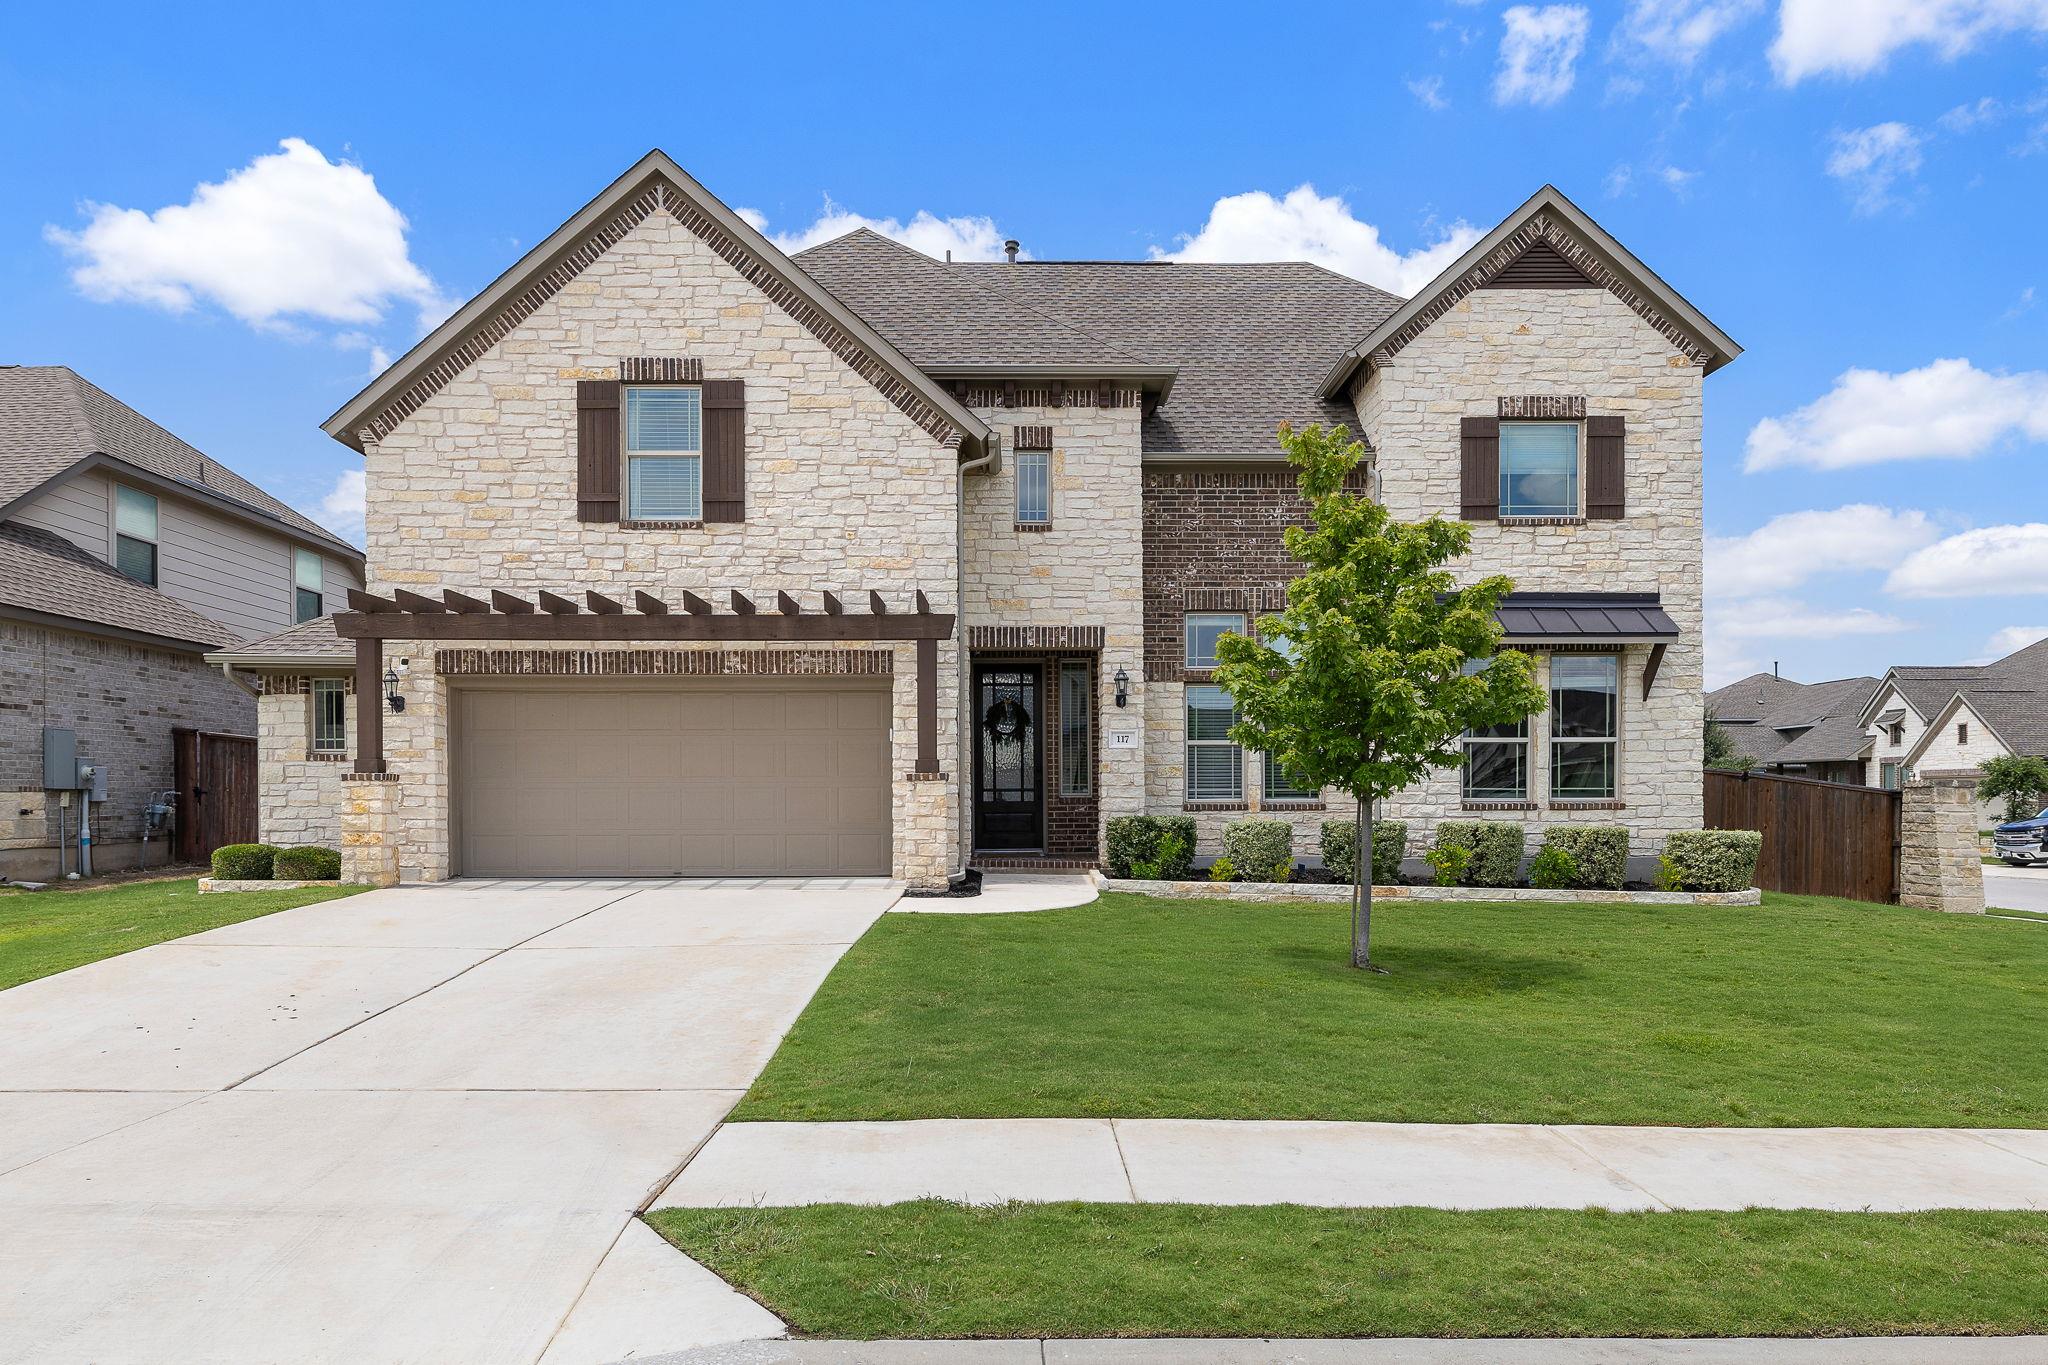 117 Rosa DrSale 2MLS # 9311538 | 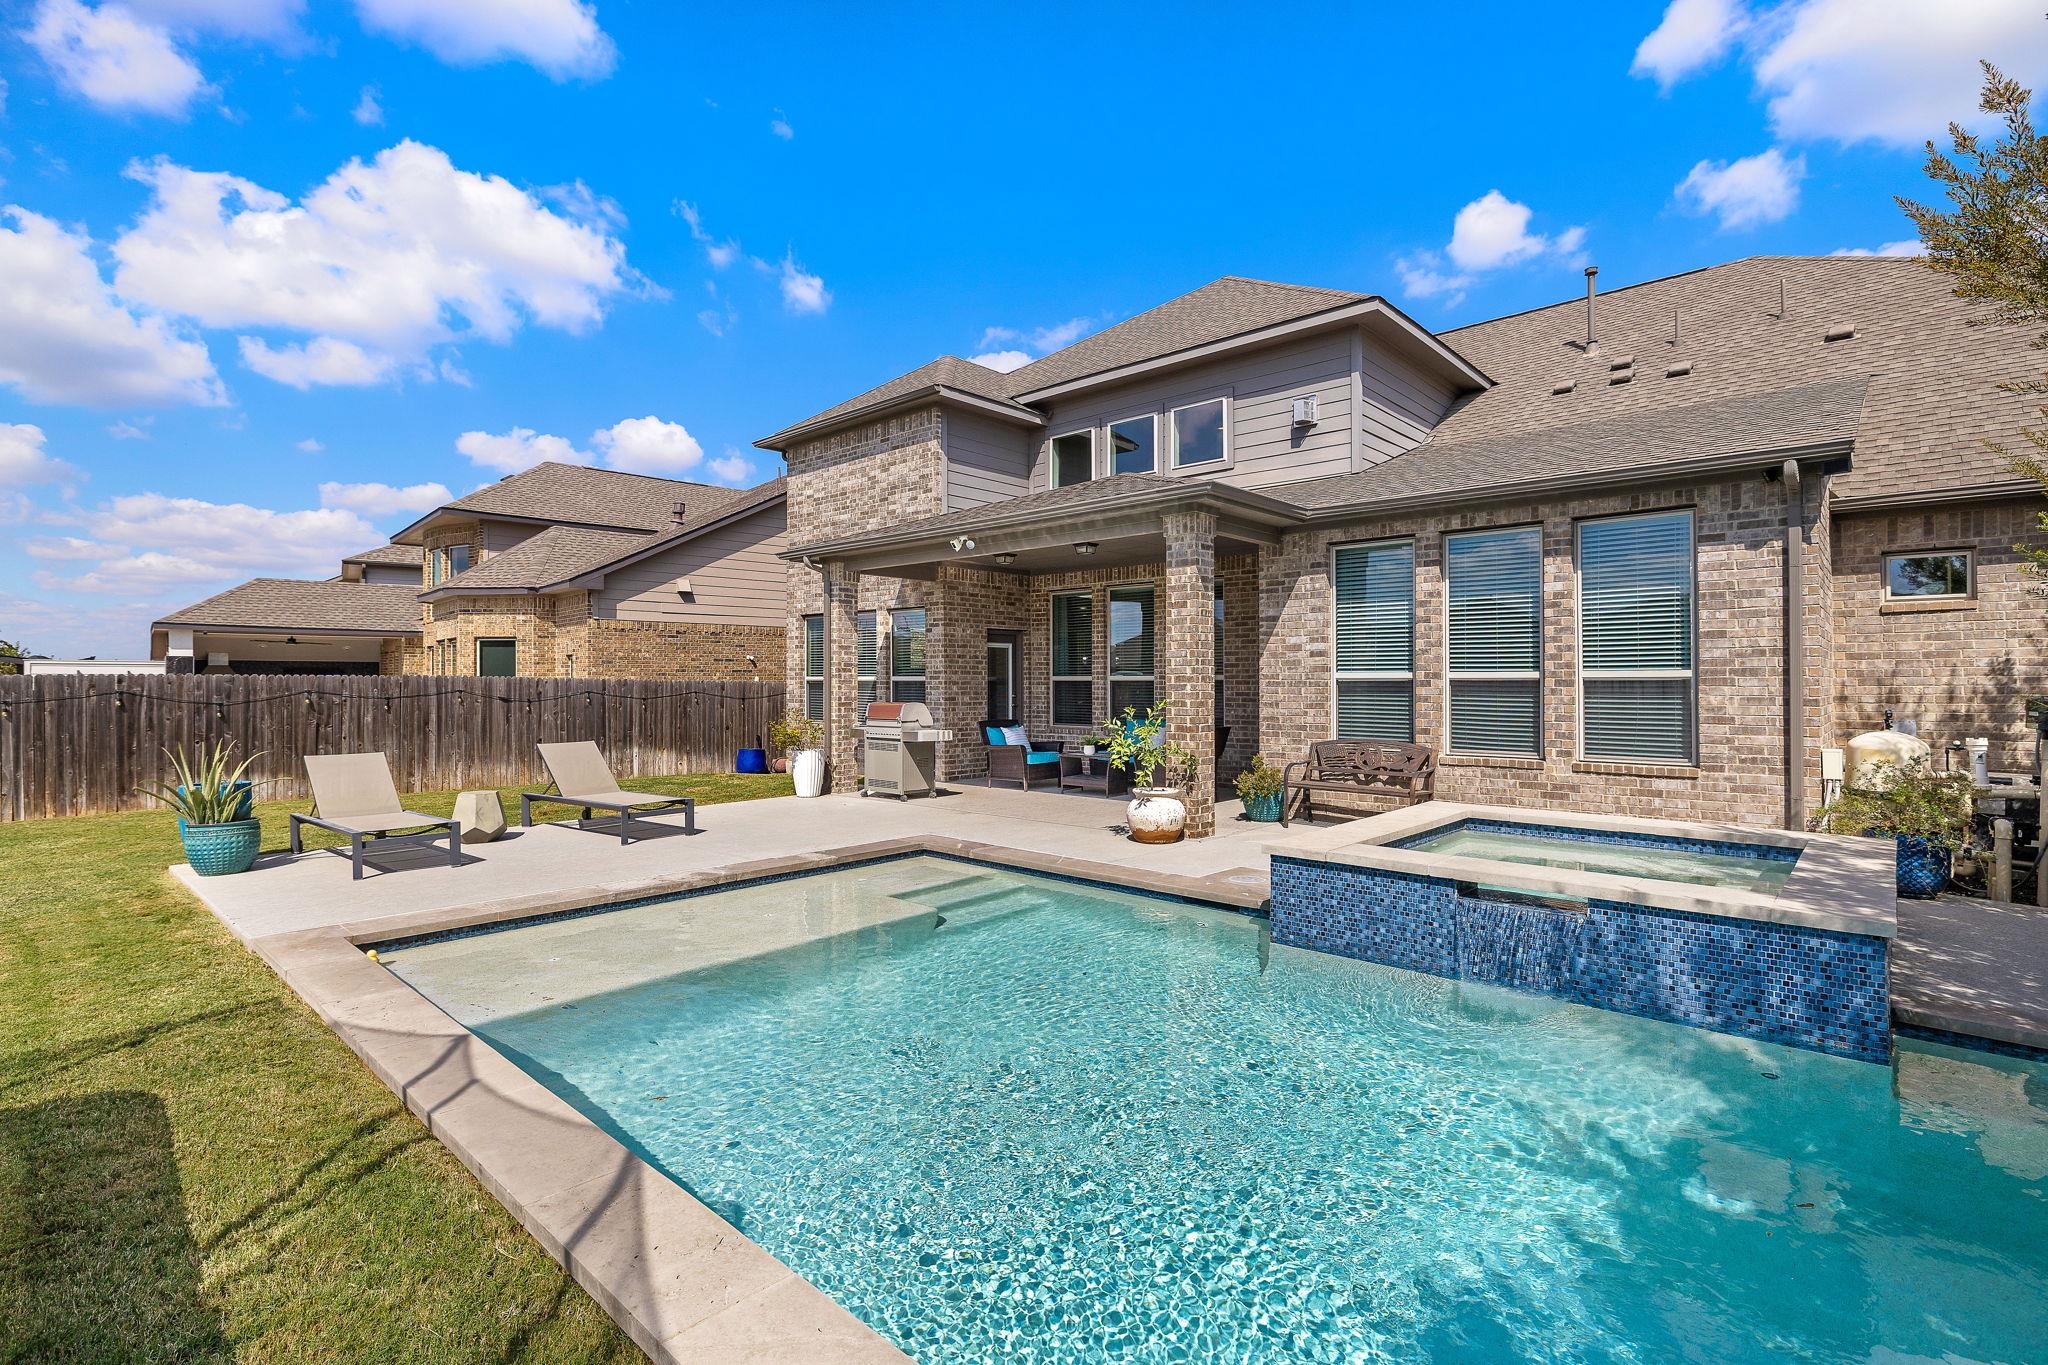 504 Leon LoopSale 3MLS # 2515741 | 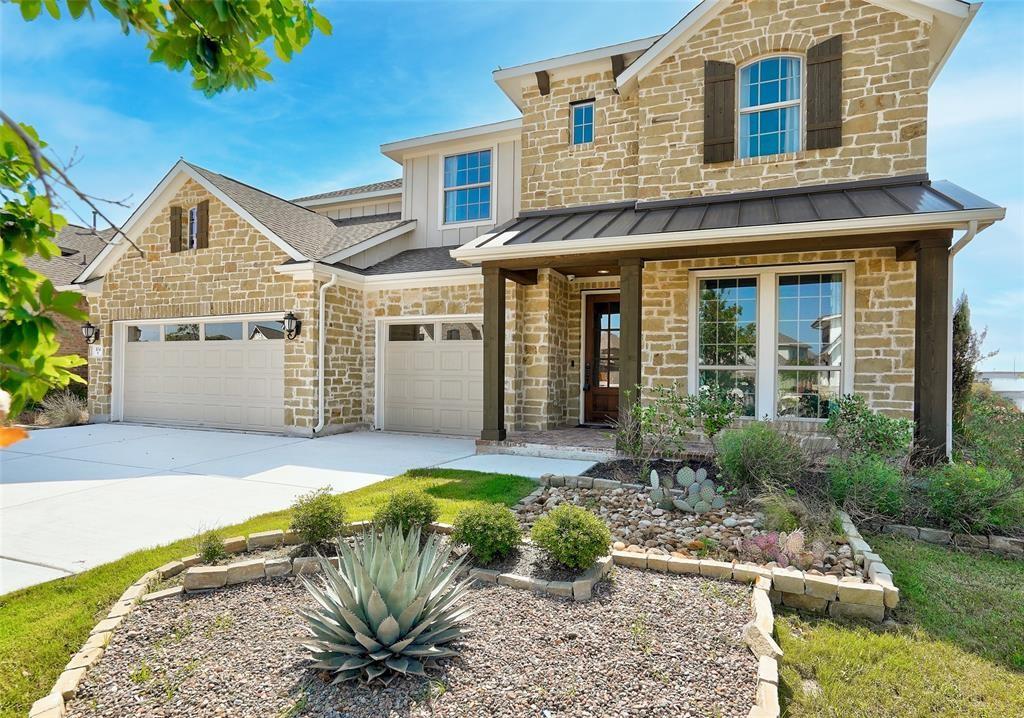 104 Leon LoopSale 4MLS # 4804904 |  109 Mark WaySale 5MLS # 5866339 | |
|---|---|---|---|---|---|---|
| Distance from this house | — | 0.38 mi N | 0.26 mi NNW | 0.07 mi WNW | 0.03 mi SE | 0.06 mi NNW |
| Living area | 3,316 SF | 3,827 SF | 3,748 SF | 2,894 SF | 3,764 SF | 3,406 SF |
| Bedrooms | 4 | 5 | 5 | 4 | 5 | 4 |
| Bathrooms | 3.1 | 4.1 | 4.1 | 2.1 | 4 | 3.1 |
| Year built | 2018 | 2020 | 2020 | 2018 | 2019 | 2018 |
| Lot area | 8,830 SF | 7,492 SF | 9,923 SF | 7,357 SF | 7,488 SF | 7,523 SF |
| Garage | 2-car | 2-car | 2-car | 3-car | 3-car | 2-car |
| Levels | Two | Two | Two | Two | Two | Two |
The sale
| 109 Leon LoopThis houseMLS # 8502031 | 216 Rieti PkwySale 1MLS # 9612655 | 117 Rosa DrSale 2MLS # 9311538 | 504 Leon LoopSale 3MLS # 2515741 | 104 Leon LoopSale 4MLS # 4804904 | 109 Mark WaySale 5MLS # 5866339 | |
|---|---|---|---|---|---|---|
| Listing date | 06/15/26 | 08/30/25 | 06/03/26 | 10/20/25 | 02/03/24 | 08/24/24 |
| Close date | Expired | 08/14/26 | 07/17/26 | 01/05/26 | 01/13/25 | 11/08/24 |
| Days on market | 127 | 316 | 8 | 32 | 285 | 49 |
| Original list price | $739,900 | $725,000 | $660,000 | $625,000 | $800,000 | $765,000 |
| Last list price | $649,900 | $655,999 | $660,000 | $625,000 | $670,000 | $735,000 |
| Closed price | — | $660,000 | $640,000 | $625,000 | $660,000 | $733,000 |
| Buyer closing costs paid by the seller | — | −$9,000 | −$3,000 | −$15,000 | — | — |
| Repairs at the buyer’s request | — | — | — | — | −$6,000 | — |
| Net sale price | — | $651,000 | $637,000 | $610,000 | $654,000 | $733,000 |
Time adjustment
| Months from sale to today | — | 2 months | 3 months | 9 months | 21 months | 23 months |
|---|---|---|---|---|---|---|
| Market trend to today | — | −$11,549 | −$22,464 | −$10,893 | −$43,304 | −$57,075 |
| Time-adjusted net sale price | — | $639,451 | $614,536 | $599,107 | $610,696 | $675,925 |
| Per SF | — | $167 | $164 | $207 | $162 | $198 |
ALEX Model & Diane Adjustments
| 109 Leon LoopThis houseMLS # 8502031 | 216 Rieti PkwySale 1MLS # 9612655 | 117 Rosa DrSale 2MLS # 9311538 | 504 Leon LoopSale 3MLS # 2515741 | 104 Leon LoopSale 4MLS # 4804904 | 109 Mark WaySale 5MLS # 5866339 | |
|---|---|---|---|---|---|---|
| Age | — | −$2,703 | −$2,564 | — | −$2,590 | −$2,789 |
| Back yard | — | — | — | — | — | — |
| Bathrooms | — | — | — | — | — | — |
| Bedroom count | — | — | — | — | — | — |
| Casita | — | — | — | — | — | — |
| Corner lot | — | — | +$4,480 | — | — | — |
| Cul-de-sac | — | — | — | — | — | — |
| Deck | — | — | — | — | — | — |
| Exterior condition | — | — | — | — | — | — |
| Fence | — | +$7,182 | — | — | — | — |
| Fireplace | — | — | — | — | +$7,346 | — |
| Flood plain | — | — | — | — | — | — |
| Foundation | — | — | — | — | — | — |
| Front yard | — | — | — | — | — | — |
| Full bath | — | −$17,469 | −$16,569 | +$16,254 | −$16,738 | — |
| Full bath 2 | — | — | — | — | — | — |
| Full bath 3 | — | — | — | — | — | — |
| Garage | — | — | −$7,421 | −$14,559 | −$14,992 | — |
| Guest suite | — | — | — | — | +$4,070 | — |
| Half bath | — | — | — | — | +$7,463 | — |
| Interior lighting | — | — | — | — | — | — |
| Interior quality | — | — | — | — | — | — |
| Kitchen | — | — | — | +$15,444 | — | — |
| Lot size | — | +$7,997 | −$5,392 | +$8,265 | +$7,689 | +$8,046 |
| Outbuilding | — | — | — | — | — | — |
| Outdoor kitchen | — | — | — | — | — | — |
| Patio | — | −$4,249 | −$4,030 | −$3,953 | −$4,071 | −$4,384 |
| Pool | — | — | — | −$44,947 | — | −$49,837 |
| Primary bath | — | — | — | — | — | — |
| Septic | — | — | — | — | — | — |
| Solar | — | — | — | — | — | — |
| Stories | — | — | — | — | — | — |
| Study office | — | — | +$6,850 | +$6,720 | +$6,920 | +$7,451 |
| Updated or remodeled | — | — | — | — | — | — |
| View | — | — | — | — | — | — |
| Visible disrepair | — | — | — | — | — | — |
| Well | — | — | — | — | — | — |
| Total ALEX Model & Diane adjustments | — | −$9,242 | −$24,646 | −$16,776 | −$4,903 | −$41,513 |
Size adjustment
| 109 Leon LoopThis houseMLS # 8502031 | 216 Rieti PkwySale 1MLS # 9612655 | 117 Rosa DrSale 2MLS # 9311538 | 504 Leon LoopSale 3MLS # 2515741 | 104 Leon LoopSale 4MLS # 4804904 | 109 Mark WaySale 5MLS # 5866339 | |
|---|---|---|---|---|---|---|
| Scaling to 3,316 SF | — | −$84,149 | −$67,992 | +$84,915 | −$72,103 | −$16,764 |
| Statistical size adjustment | — | +$50,942 | +$41,329 | −$54,194 | +$43,792 | +$10,379 |
| Total size adjustment | — | −$33,207 | −$26,663 | +$30,721 | −$28,311 | −$6,385 |
Scaling to 3,316 SF. The homes that sold vary in size relative to this one. To compare them fairly, each sale’s price is first restated at this home’s size, using the sale’s own price per SF. For example, 216 Rieti Pkwy has 3,827 SF. Its price after the time adjustment and all feature adjustments, including any made by Diane, is $630,209. Restated at this home’s size: $630,209 × 3,316 ÷ 3,827 = $546,060. The scaling line for 216 Rieti Pkwy is the difference, −$84,149.
Statistical size adjustment. Scaling at a sale’s own price per SF assumes that price per SF stays the same as size changes. It does not. Smaller homes usually sell for more per SF than larger ones. Every home has a kitchen, bathrooms and a lot, and those cost about the same whatever its size. Scaling alone therefore overstates the value of a sale smaller than this home and understates the value of a larger one. Five sales are too few to measure reliably how price per SF changes with size, so ALEX measured it from 15,182 sales in the ABOR market: resales priced $600,000 to $1,000,000, closed since July 2023, holding age, lot, rooms and date of sale constant, and applies that correction to each sale. For 216 Rieti Pkwy the statistical size adjustment is +$50,942, so its total size adjustment is −$33,207. The further a sale’s size is from this home’s, the larger the correction.
Final valuation
| 109 Leon LoopThis houseMLS # 8502031 | 216 Rieti PkwySale 1MLS # 9612655 | 117 Rosa DrSale 2MLS # 9311538 | 504 Leon LoopSale 3MLS # 2515741 | 104 Leon LoopSale 4MLS # 4804904 | 109 Mark WaySale 5MLS # 5866339 | |
|---|---|---|---|---|---|---|
| Net sale price | — | $651,000 | $637,000 | $610,000 | $654,000 | $733,000 |
| Time adjustment | — | −$11,549 | −$22,464 | −$10,893 | −$43,304 | −$57,075 |
| Time-adjusted net sale price | — | $639,451 | $614,536 | $599,107 | $610,696 | $675,925 |
| ALEX Model & Diane adjustments | — | −$9,242 | −$24,646 | −$16,776 | −$4,903 | −$41,513 |
| Adjusted value | — | $630,209 | $589,890 | $582,331 | $605,793 | $634,412 |
| Size adjustment | — | −$33,207 | −$26,663 | +$30,721 | −$28,311 | −$6,385 |
| Final adjusted value | — | $597,002 | $563,227 | $613,052 | $577,482 | $628,027 |
| Final adjusted sale price per SF | — | $180 | $170 | $185 | $174 | $189 |